The radical SAM superfamily (RSS) is arguably the largest and most functionally diverse enzyme superfamily. Many functions (and intriguing reaction mechanisms) have been discovered; many more remain to be discovered!
RadicalSAM.org is designed to leverage "top-down" discovery of function using the EFI’s genomic enzymology web tools. The sequence similarity network (SSN) for the RSS is too large to be analyzed with Cytoscape and the RAM available on most computers so has been inaccessible to RSS community.
We generated the SSN for the entire RSS using a computer with 1.5TB RAM and segregated it into clusters for 1) the 20 subgroups curated by the Structure-Function Linkage Database (SFLD) and 2) many additional subgroups not curated by the SFLD.
For each subgroup, RadicalSAM.org provides:
- The SSN, multiple sequence alignment (MSA), WebLogo, hidden Markov model (HMM), length histogram, taxonomic distribution, SwissProt annotations, and number and locations of conserved Cys residues.
- Genome neighborhood diagrams (GNDs) for bacterial, archaeal, and fungal members that provide metabolic pathway context for inference of functions.
- UniProt, UniRef90, and UniRef50 IDs and FASTA sequences that can be used with EFI-EST, EFI-GNT, and EFI-CGFP for user-specific applications.
- For functionally diverse subgroups, the ability to "walk" through a series of SSNs generated at increasing alignment scores ("dicing"). The progeny (walking forward) and progenitors of a cluster (walking backward) can be identified, facilitating the discovery of related functions and/or substrate specificities.
This version of RadicalSAM.org uses sequences in the UniProt Release 2024_01 and InterPro Release 98 databases (January 24, 2024). The dataset includes 857,767 total sequences ("complete" and fragments), 800,748 "complete sequences, 793,039 with ≥140 residues. "Dicing" is provided for 23 functionally diverse subgroups.
The previous version of RadicalSAM.org included sequences in UniProt Release 2020_05 and InterPro Release 82 databases (October 7, 2020). That dataset included 620,386 "complete" sequences, 616,009 with ≥140 residues. "Dicing" was provided for 4 functionally diverse subgroups.
Important information about sequences in RadicalSAM.org:
- The number of sequences in the UniProt database now is “constant” at ~250M, despite the increasing number of sequenced genomes. UniProt is continually redefining its proteomes to reflect increasing taxonomic diversity, retiring "redundant" proteomes to the UniParc database. As a result, some sequences in the original version may not be present in the updated version.
- UniProt often assigns a new UniProt ID to a sequence, retiring the original UniProt ID. Therefore, the same sequence (from the same organism) may be present in both the original and updated versions but the UniProt IDs may not be the same.
- Clusters in a subgroup SSN are numbered in order of decreasing number of nodes in the clusters. As a result, the cluster number containing a sequence of interest in the updated version may not be the same as the cluster number in the original version.
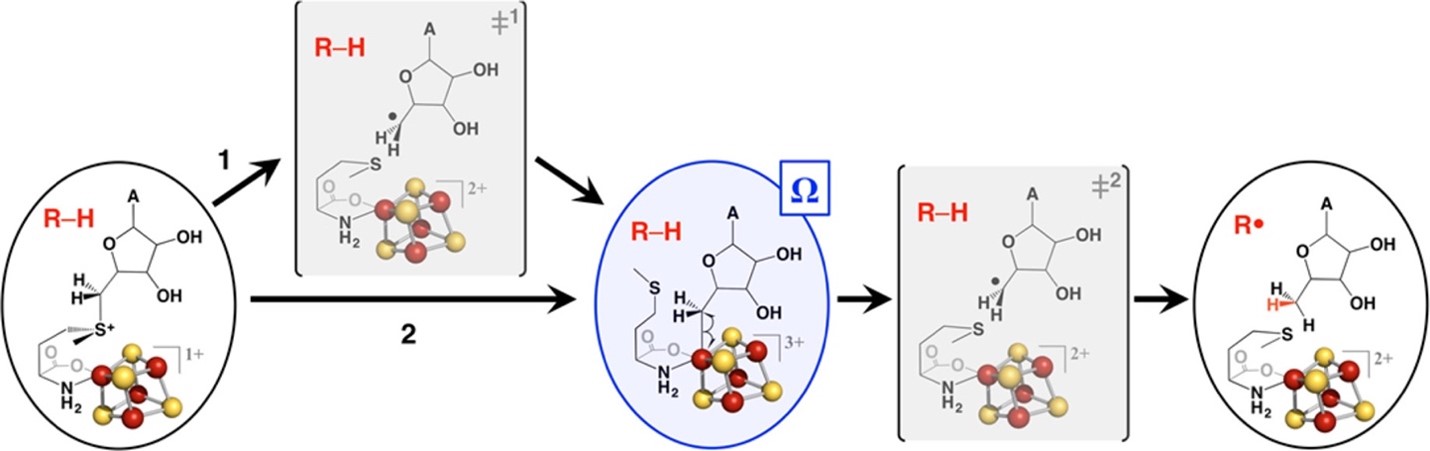
The radical SAM superfamily (RSS) is arguably the largest and most functionally diverse enzyme superfamily. Its members contain a Fe4S4 cluster near the N-terminus of a (β/α)6-barrel domain that binds S-adenosyl methionine (SAM); one-electron reduction of the bound SAM yields Met and an organometallic intermediate, designated Ω, in which the 5′-deoxyadenosyl radical (5′-dAdo•) is bound to an Fe of the Fe4S4 cluster. When liberated, the 5′-dAdo• generates a substrate radical (R•) (and 5′-deoxyadenosine) that undergoes intriguing and often complex chemistry to yield the product (https://doi.org/10.1021/jacs.8b04061; https://doi.org/10.1146/annurev-biochem-052621-090638).
The SFLD (http://sfld.rbvi.ucsf.edu/archive/django/index.html) used an SSN to segregate the RSS into 20 subgroups with characterized functions and 22 without characterized functions. Their analysis was described in Methods in Enzymology Volume 606 in 2018: Atlas of the Radical SAM Superfamily: Divergent Evolution of Function Using an "Plug and Play" Domain, G.L. Holliday, E. Akiva, E.C. Meng, S.D. Brown, S. Calhoun, U. Pieper, A. Sali, S.J. Booker and P.C. Babbitt (doi: 10.1016/bs.mie.2018.06.004).
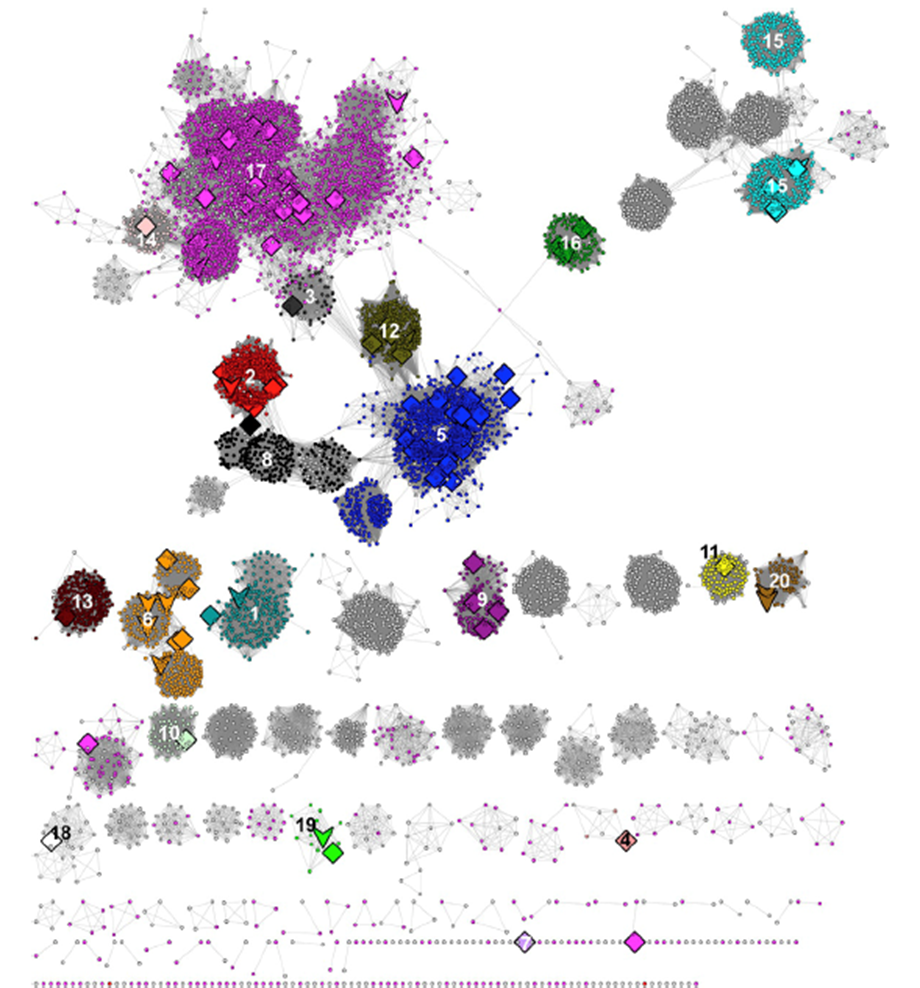
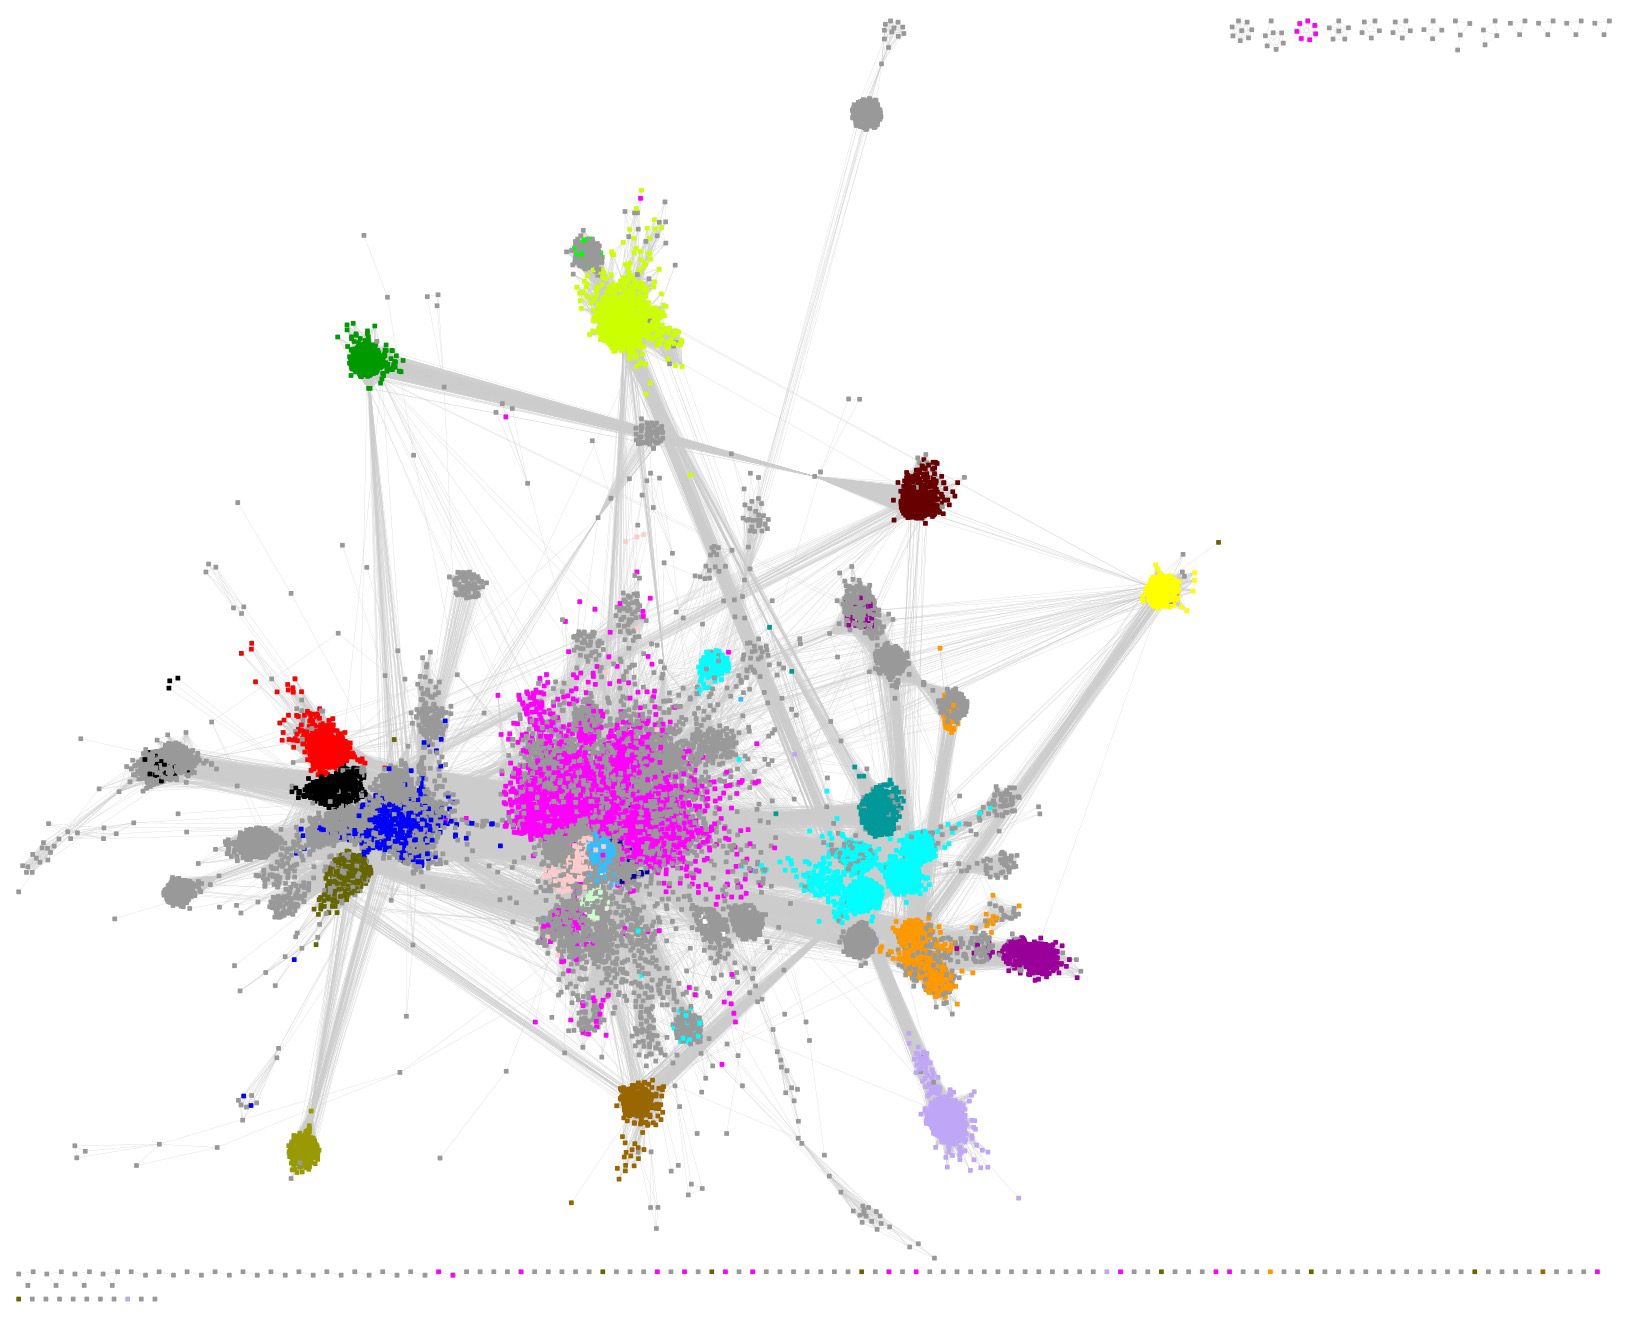
At the time of the SFLD's analyses (2017), the RSS included 113,776 sequences that were collected at 50% sequence identity into 10,741 representative nodes so that the SSN could be visualized and analyzed using Cytoscape (https://cytoscape.org/). The SSN is reproduced below (Figure 5 in the Atlas; minimum e-value threshold to draw edges between nodes is 1e-20), with the characterized subgroups numbered and colored as described by the SFLD.
We provide a web resource with three "democratized" genomic enzymology tools (https://efi.igb.illinois.edu/; https://doi.org/10.1021/acs.biochem.9b00735; https://doi.org/10.1016/j.jmb.2023.168018) The tools are used to 1) explore sequence-function space in protein families using SSNs (generated with EFI-EST), 2) collect and explore genome neighborhoods for clues about functions of uncharacterized enzymes (collected with EFI-GNT), and 3) prioritize uncharacterized SSN clusters for functional assignment based on human microbiome metagenome abundance (chemically guided functional profiling with EFI-CGFP).
Unfortunately, most experimentalists interested in the RSS cannot take full advantage of the tools:
- The SSN for the RSS is too large to be visualized/analyzed with Cytoscape using the RAM installed on most computers.
- The SSN contains many clusters/subgroups that were not curated by the SFLD.
- Regularly updated lists of the members of the subgroups are not available.
We developed RadicalSAM.org to provide lists of accession IDs (UniProt, UniRef90, and UniRef50) for the SFLD-curated subgroups and uncurated subgroups so that their SSNs can generated with EFI-EST. For most of SFLD subgroups and additional clusters, the number of UniRef50 IDs is sufficiently small that useful SSNs can be visualized and analyzed with Cytoscape using typically available computers.
RadicalSAM.org also provides information about each subgroup to aid target selection and inference of function, including the multiple sequence alignment (MSA), WebLogo, hidden Markov model (HMM), length histogram, phylogenetic distribution, SwissProt annotations, and number and locations of conserved Cys residues.
Importantly, RadicalSAM.org provides genome context (genome neighborhood networks, GNNs, and genome neighborhood diagrams, GNDs) for the bacterial and archaeal members of the subgroups, thereby providing metabolic pathway context for inferring novel enzymatic activities and physiological functions.
This release of RadicalSAM.org includes RSS sequences in UniProt Release 2024_01/InterPro Release 98 (January 24, 2024). The Family option of EFI-EST was used to collect sequences from the UniRef50 database using as query a list of 205 InterPro families/domains and 10 Pfam families; the list of families is provided in the Sequence Families tab. UniRef50 clusters were used because these provide a manageable number of SSN nodes and edges (using a Mac Pro desktop with 1.5 TB RAM). The UniRef database is described at: https://www.uniprot.org/help/uniref.
Using this list of families/domains, we identified 857,767 UniProt IDs (782,720 unique sequences). As explained elsewhere, we use only "complete" sequences as identified by UniProt (start and stop codons for the translated sequences). We identified 800,748 "complete" sequences (727,091 unique sequences).
As explained elsewhere, we imposed a minimum length of ≥140 residues to restrict the "complete" sequences to those that are sufficiently long to be enzymatically active. We identified 793,039 sequences with ≥140 residues (719,584 unique sequences).
The initial SSN used to segregate the RSS into "manageable" megaclusters and clusters for further analyses contained 74,037 UniRef50 clusters. The UniRef50 clusters then were expanded to their constituent UniRef90 clusters (containing "complete" sequences that were length-filtered to include sequences with ≥140 residues) to allow higher resolution analyses of genome context.
The previous version of RadicalSAM.org included sequences in the UniProt 2020_05 and InterPro 82 databases (October 7, 2020). That dataset included 620,386 "complete" sequences, 616,009 with ≥140 residues.
| Family | Short Name |
|---|---|
| IPR000385 | MoaA_NifB_PqqE_Fe-S-bd_CS |
| IPR001989 | Radical_activat_CS |
| IPR002684 | Biotin_synth/BioAB |
| IPR003698 | Lipoyl_synth |
| IPR003739 | Lys_aminomutase/Glu_NH3_mut |
| IPR004383 | rRNA_lsu_MTrfase_RlmN/Cfr |
| IPR004558 | Coprogen_oxidase_HemN |
| IPR004559 | HemW-like |
| IPR005839 | Methylthiotransferase |
| IPR005840 | Ribosomal_uS12_MeSTrfase_RimO |
| IPR005909 | RaSEA |
| IPR005911 | YhcC-like |
| IPR005980 | Nase_CF_NifB |
| IPR006463 | MiaB_methiolase |
| IPR006466 | MiaB-like_arc_euk |
| IPR006467 | MiaB-like_bact |
| IPR006638 | Elp3/MiaA/NifB-like_rSAM |
| IPR007197 | rSAM |
| IPR010505 | MoaA_twitch |
| IPR010722 | BATS_dom |
| IPR010723 | HemN_C |
| IPR011101 | DUF5131 |
| IPR011843 | PQQ_synth_PqqE_bac |
| IPR012726 | ThiH |
| IPR012837 | NrdG |
| IPR012838 | PFL1_activating |
| IPR012839 | Organic_radical_activase |
| IPR013483 | MoaA |
| IPR013704 | UPF0313_N |
| IPR013848 | Methylthiotransferase_N |
| IPR013917 | tRNA_wybutosine-synth |
| IPR014191 | Anaer_RNR_activator |
| IPR016431 | Pyrv-formate_lyase-activ_prd |
| IPR016771 | Fe-S_OxRdtase_rSAM_TM0948_prd |
| IPR016779 | rSAM_MSMEG0568 |
| IPR016863 | DesII |
| IPR017200 | PqqE-like |
| IPR017672 | MA_4551-like |
| IPR017742 | Deazaguanine_synth |
| IPR017833 | Hopanoid_synth-assoc_rSAM_HpnH |
| IPR017834 | Hopanoid_synth-assoc_rSAM_HpnJ |
| IPR019939 | CofG_family |
| IPR019940 | CofH_family |
| IPR020050 | FO_synthase_su2 |
| IPR020612 | Methylthiotransferase_CS |
| IPR022431 | Cyclic_DHFL_synthase_mqnC |
| IPR022432 | MqnE |
| IPR022447 | Lys_aminomutase-rel |
| IPR022459 | Lysine_aminomutase |
| IPR022462 | EpmB |
| IPR022881 | rRNA_lsu_MeTfrase_Cfr |
| IPR022946 | UPF0313 |
| IPR023404 | rSAM_horseshoe |
| IPR023805 | Uncharacterised_Spl-rel |
| IPR023807 | Peptide_mod_rSAM |
| IPR023819 | Pep-mod_rSAM_AF0577 |
| IPR023820 | rSAM_GDL-assoc |
| IPR023821 | rSAM_TatD-assoc |
| IPR023822 | rSAM_TatD-assoc_bac |
| IPR023858 | RSAM_HmdB |
| IPR023862 | CHP03960_rSAM |
| IPR023863 | rSAM_PTO1314 |
| IPR023867 | Sulphatase_maturase_rSAM |
| IPR023868 | 7-CO-7-deazaGua_synth_put_Clo |
| IPR023874 | DNA_rSAM_put |
| IPR023880 | Benzylsucc_Synthase_activating |
| IPR023885 | 4Fe4S-binding_SPASM_dom |
| IPR023886 | QH-AmDH_gsu_maturation |
| IPR023891 | Pyrrolys_PylB |
| IPR023897 | SPL_firmicutes |
| IPR023904 | Pep_rSAM_mat_YydG |
| IPR023912 | YjjW_bact |
| IPR023913 | MftC |
| IPR023930 | NirJ1 |
| IPR023969 | CHP04072_B12-bd/rSAM |
| IPR023979 | CHP04014_B12-bd/rSAM |
| IPR023980 | CHP04013_B12-bd/rSAM |
| IPR023984 | rSAM_ocin_1 |
| IPR023992 | HemeD1_Synth_NirJ |
| IPR023993 | TYW1_archaea |
| IPR023995 | HemZ |
| IPR024001 | Cys-rich_pep_rSAM_mat_CcpM |
| IPR024007 | FeFe-hyd_mat_HydG |
| IPR024016 | CHP04064_rSAM |
| IPR024017 | Pep_cycl_rSAM |
| IPR024018 | CHP04083_rSAM |
| IPR024021 | FeFe-hyd_HydE_rSAM |
| IPR024023 | rSAM_paired_HxsB |
| IPR024025 | SCIFF_rSAM_maturase |
| IPR024032 | rSAM_paired_HxsC |
| IPR024177 | Biotin_synthase |
| IPR024521 | ArsS-like_C |
| IPR024560 | UPF0313_C |
| IPR024924 | 7-CO-7-deazaguanine_synth-like |
| IPR025895 | LAM_C_dom |
| IPR026322 | Geopep_mat_rSAM |
| IPR026332 | HutW |
| IPR026335 | rSAM_SPASM_FxsB |
| IPR026344 | SCM_rSAM_ScmE |
| IPR026346 | SCM_rSAM_ScmF |
| IPR026351 | rSAM_ArsS-like |
| IPR026357 | rSAM_SPASM_GrrM_OscB |
| IPR026401 | CXXX_matur |
| IPR026404 | rSAM_w_lipo |
| IPR026407 | SAM_GG-Bacter |
| IPR026412 | rSAM_Cxxx_rpt |
| IPR026423 | rSAM_cobopep |
| IPR026426 | rSAM_FibroRumin |
| IPR026429 | MIA_synthase |
| IPR026447 | B12_SAM_Ta0216 |
| IPR026482 | rSAM_nif11_3 |
| IPR027492 | RNA_MTrfase_RlmN |
| IPR027526 | Lipoyl_synth_chlpt |
| IPR027527 | Lipoyl_synth_mt |
| IPR027559 | B12_rSAM_oligo |
| IPR027564 | HpnR_B12_rSAM |
| IPR027570 | GeoRSP_rSAM |
| IPR027583 | rSAM_ACGX |
| IPR027586 | rSAM_metal_mat |
| IPR027596 | AmmeMemoSam_rS |
| IPR027604 | W_rSAM_matur |
| IPR027608 | Spiro_SPASM |
| IPR027609 | rSAM_QueE_proteobac |
| IPR027621 | rSAM_QueE_gams |
| IPR027622 | rSAM_Clo7bot |
| IPR027626 | Pseudo_SAM_Halo |
| IPR027633 | rSAM_NirJ2 |
| IPR030801 | Glu_2_3_NH3_mut |
| IPR030837 | BzaD-like |
| IPR030894 | Ahb_Proteobacteria |
| IPR030896 | rSAM_AhbD_hemeb |
| IPR030905 | CutC_activ_rSAM |
| IPR030915 | rSAM_SkfB |
| IPR030933 | Non_iron_rSAM |
| IPR030950 | rSAM_PoyD |
| IPR030969 | B12_rSAM_trp_MT |
| IPR030977 | QueE_Cx14CxxC |
| IPR030989 | rSAM_SPASM_XyeB |
| IPR031003 | BcpD_PhpK_rSAM |
| IPR031004 | rSAM_YfkAB |
| IPR031010 | rSAM_mob_pairA |
| IPR031012 | rSAM_mob_pairB |
| IPR031014 | rSAM_BlsE |
| IPR031015 | Arg_2_3_am_muta |
| IPR031019 | rSAM_vs_C_rich |
| IPR031691 | LIAS_N |
| IPR032432 | Radical_SAM_C |
| IPR033971 | Avilamycin_epimerase |
| IPR033974 | Glycerol_dehydratase_activase |
| IPR033975 | ThnP-like |
| IPR033976 | GntE-like |
| IPR034165 | NifB_C |
| IPR034386 | BtrN-like |
| IPR034391 | Cmo-like_SPASM_containing |
| IPR034405 | F420 |
| IPR034422 | HydE/PylB-like |
| IPR034428 | ThiH/NoCL/HydG-like |
| IPR034436 | NocN/NosN-like |
| IPR034438 | 4-hPhe_decarboxylase_activase |
| IPR034457 | Organic_radical-activating |
| IPR034462 | Benzylsuc_synthase_activase |
| IPR034465 | Pyruvate_for-lyase_activase |
| IPR034466 | Methyltransferase_Class_B |
| IPR034471 | GDGT/MA_synthase |
| IPR034474 | Methyltransferase_Class_D |
| IPR034479 | AhbC-like |
| IPR034480 | Heme_carboxy_lyase-like |
| IPR034485 | Anaerobic_Cys-type_sulfatase-m |
| IPR034491 | Anaerob_Ser_sulfatase-maturase |
| IPR034497 | Bacteriochlorophyll_C12_MT |
| IPR034498 | Bacteriochlorophyll_C8_MT |
| IPR034505 | Coproporphyrinogen-III_oxidase |
| IPR034508 | Spectinomycin_biosynthesis |
| IPR034514 | ThnK-like |
| IPR034515 | ThnL-like |
| IPR034519 | TunB-like |
| IPR034529 | Fom3-like |
| IPR034530 | HpnP-like |
| IPR034531 | Methylation_of_yatakemycin |
| IPR034532 | OxsB-like |
| IPR034534 | Pyrimidine_methyltransferase |
| IPR034547 | Tte1186a_maturase |
| IPR034556 | tRNA_wybutosine-synthase |
| IPR034557 | ThrcA_tRNA_MEthiotransferase |
| IPR034559 | SPL_Clostridia |
| IPR034560 | SPL_Bacilli |
| IPR034687 | ELP3-like |
| IPR038135 | Methylthiotransferase_N_sf |
| IPR039661 | ELP3 |
| IPR040072 | Methyltransferase_A |
| IPR040074 | BssD/PflA/YjjW |
| IPR040081 | CndI-like |
| IPR040082 | GenK-like |
| IPR040085 | MJ0674-like |
| IPR040086 | MJ0683-like |
| IPR040087 | MJ0021-like |
| IPR040088 | MJ0103-like |
| IPR045375 | Put_radical_SAM-like_N |
| IPR045567 | CofH/MnqC-like_C |
| IPR045784 | Radical_SAM_N2 |
| IPR047207 | SPASM_anSME |
| IPR047602 | SPASM_CteB-like |
| IPR047771 | Radical_SAM_STM4011-like |
| PF04055 | Radical_SAM |
| PF06969 | HemN_C |
| PF08497 | Radical_SAM_N |
| PF12345 | DUF3641 |
| PF13186 | SPASM |
| PF16199 | Radical_SAM_C |
| PF16881 | LIAS_N |
| PF19238 | Radical_SAM_2 |
| PF19288 | CofH_C |
| PF19864 | Radical_SAM_N2 |
Sequence Status
UniProt designates the "Sequence Status" for each sequence: "Complete" if the encoding DNA sequence includes both a start and stop codon; "Fragment" if one or both codons is/are absent. A "Fragment" may result if the coding DNA sequence is at the end of a contig. A "Complete" sequence need not to be a "full length" sequence, e.g., it may be truncated as the result of sequencing errors that produce incorrect start and/or stop codons.
Option B identified 857,767 UniProt IDs (782,720 unique sequences). As described elsewhere, we used only "complete" sequences as identified by UniProt (start and stop codons for the translated sequences). We identified 800,748 "complete" sequences (727,091 unique sequences).
Minimum Sequence Length
We remove "short" (truncated) sequences from our datasets to 1) improve the quality of the MSAs used to generate WebLogos and HMMs and 2) minimize the number of singletons in SSNs generated with alignment scores that collect sequences into "isofunctional" clusters. We designate sequences as "short" if they cannot encode a functional RSS enzyme. By inspecting the UniProt ID length histograms for the subgroups in RadicalSAM.org (generated using the Cluster Analysis utility of EFI-EST), we identified the anaerobic ribonucleotide-triphosphate reductase activating enzyme family with members that contain ≥140 residues (Megacluster-3-5) as the "shortest" functional RSS family.
Therefore, we used UniRef50 IDs that contain ≥140 residues to construct the SSN for the RSS. We identified 793,039 sequences with ≥140 residues (719,584 unique sequences). These were contained in 74,037 UniRef50 clusters.
Length Histograms
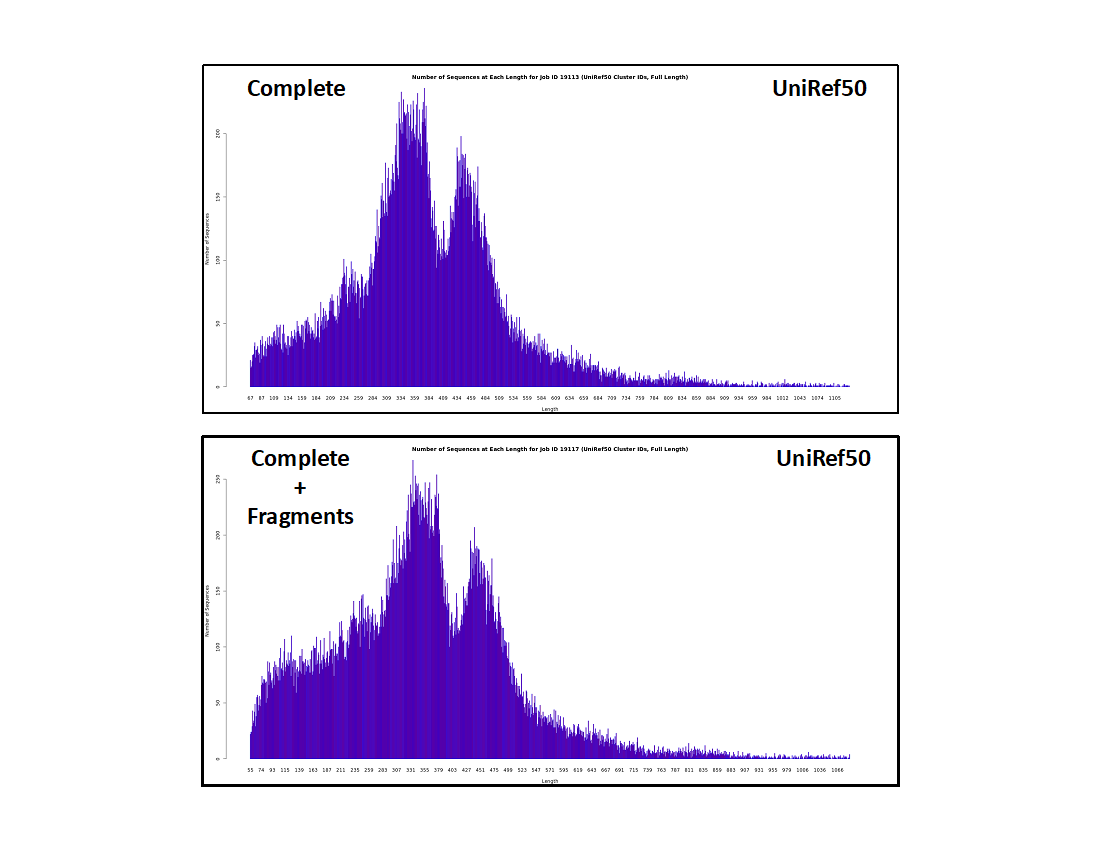
It is instructive for the user to be familiar with the length distribution of the UniRef50 IDs (i.e., nodes) in our datasets and resulting SSNs. The length histograms (UniProt IDs, UniRef90 cluster IDs, and UniRef50 cluster IDs) for the "Complete" and "Complete" plus "Fragment" datasets are shown below.
UniProt IDs
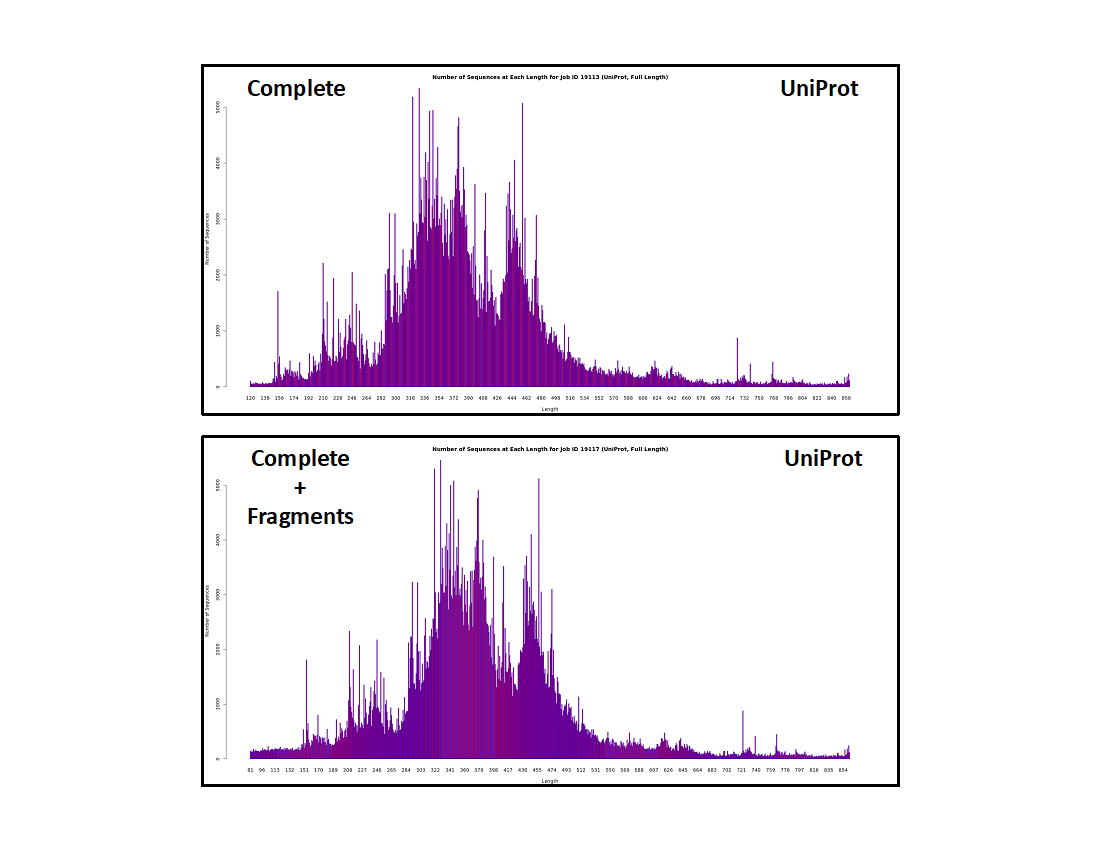
- The "Complete" dataset contains "short" sequences (<140 residues; too short to be functional) although they are designated "Complete" by UniProt. These result from sequencing errors but, since the encoding DNA has start and stop codons, they cannot be distinguished from "full length" sequences when deposited in UniProt.
- The "Complete" plus "Fragment" dataset contains a larger fraction of "short" sequences, the additional sequences contributed by those encoded by DNA without start and/or stop codons.
UniRef90 cluster IDs
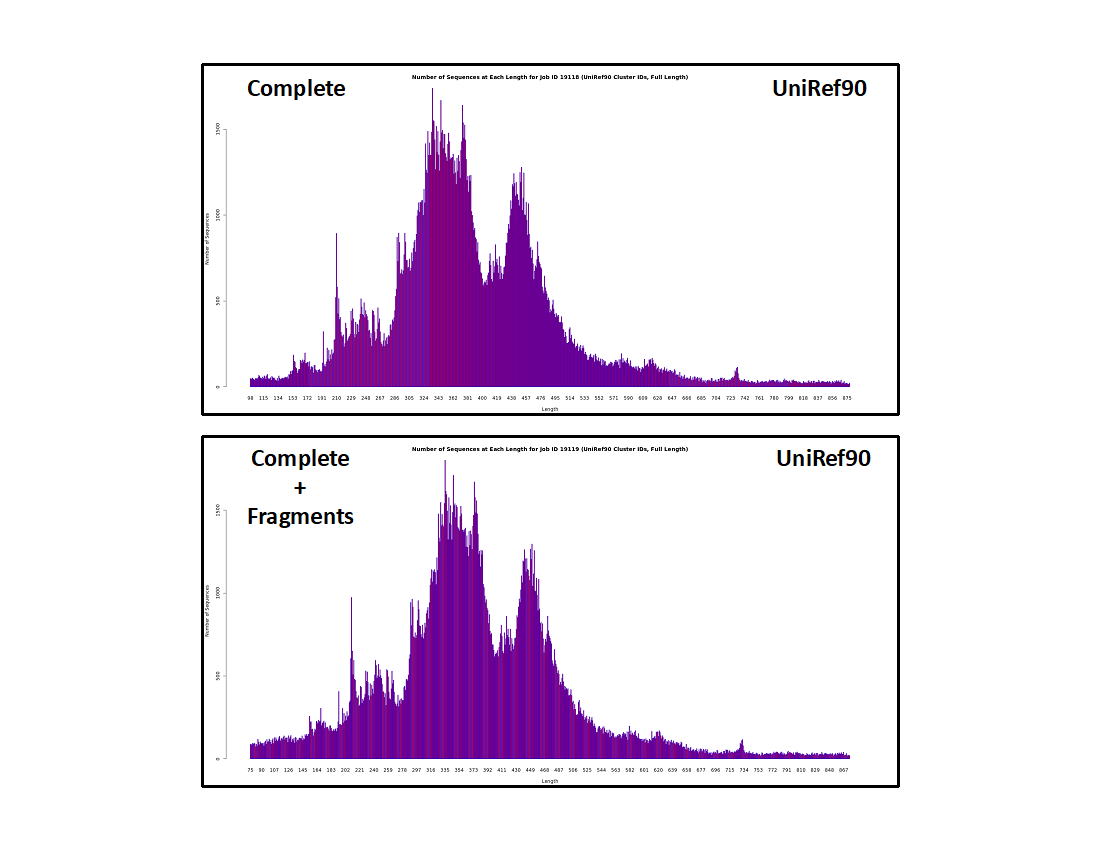
- The histograms are similar to those for the UniProt IDs, albeit lower resolution because sequences that share ≥90% sequence identity are conflated in the same UniRef90 cluster.
- The fraction of "short" sequences is larger than in the UniProt ID histograms. These result from "random" unique sequences instead of homologous "full length" sequences of similar length. As result, the "short" clusters are less likely to include multiple sequences so they constitute a larger fraction of the cluster IDs.
UniRef50 cluster IDs
- The histograms are even lower resolution because sequences that share ≥50% sequence identity are conflated in the same UniRef50 cluster.
- The fraction of "short" clusters is further increased. Although the absolute number of sequences in the "short" UniRef50 clusters are the same as in the UniRef90 clusters and the UniProt IDs, the fraction of "short" clusters increases, again because these result from "random" unique sequences instead of homologous "full length" sequences of similar length.
With its large number of sequences, the RSS requires a large-scale approach for identifying subgroups with related functions. Following the strategy used by the SFLD, we generated the SSN for the RSS using UniRef50 cluster IDs and then segregated it into clusters, some defining the 20 SFLD-curated subgroups and others defining uncharacterized sequences. In this section, we describe our procedure for identifying subgroups.
Given the large numbers of sequences and SSN clusters, we cannot guarantee that the subgroup segregation is "perfect". Indeed, we expect that it is not. However, the identified subgroups provide manageable starting points for the discovery of novel functions using EFI-EST, EFI-GNT, and EFI-CGFP.
Subgroup Identification
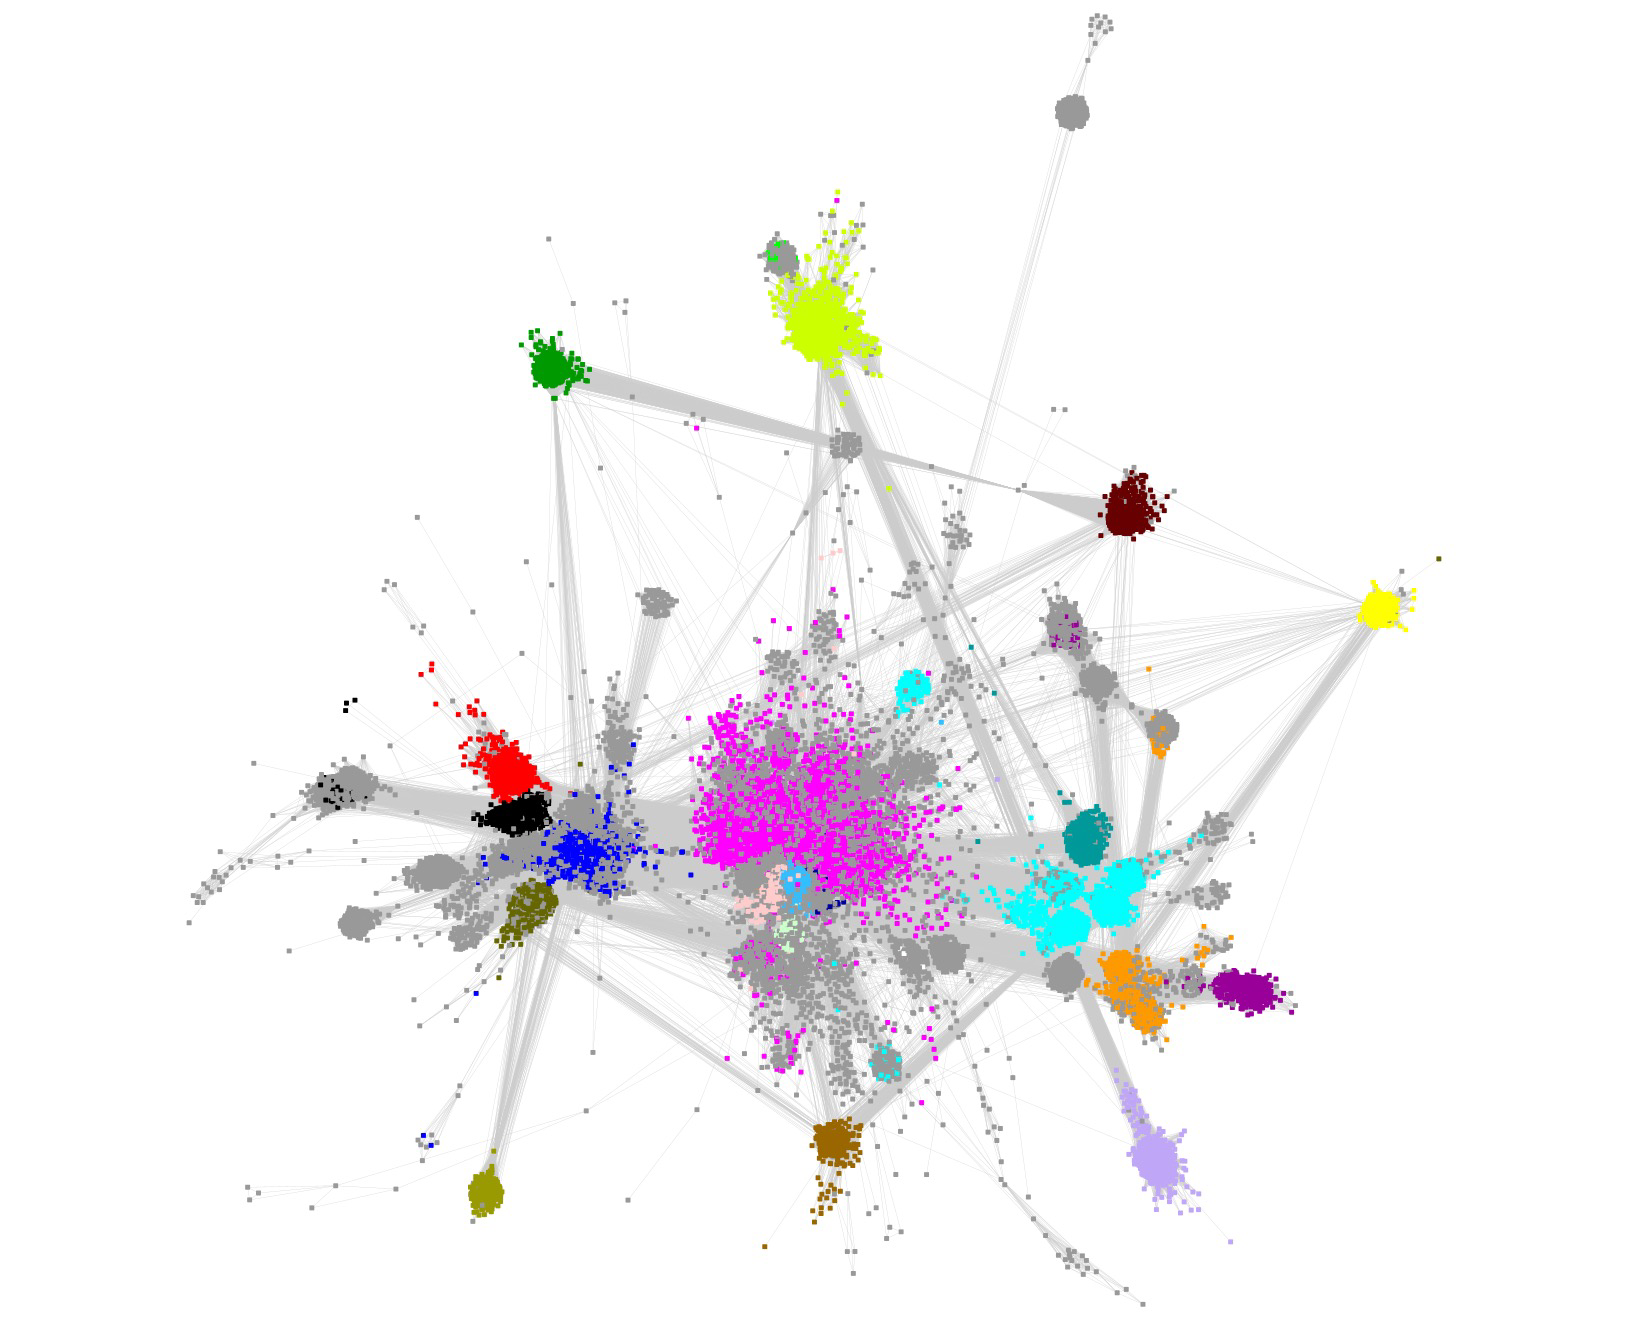
The SSN for the RSS contains 74,037 UniRef clusters/nodes and 88,965,379 edges. We used an alignment score of 11 that collects the UniRef50 clusters into identifiable SFLD subgroups and minimizes the number of singletons (visual inspection). A Mac Pro desktop computer with 1.5TB RAM was used to visualize and manipulate the SSN using Cytoscape 3.10.1.
The large cluster (73,844 nodes and 88,963,633 edges) was selected for identification of the subgroups. The UniRef50 nodes contain 417,743 UniRef90 clusters and 785,226 UniProt IDs.
The UniRef50 nodes associated with SFLD subgroups were identified by coloring the nodes according to the InterPro family (F)/domain (D) that includes the SFLD subgroup (Table 1); the node colors for the SFLD-curated subgroups are those used by the SFLD. Clusters associated with four additional families/domains described by InterPro were also colored.
| Subgroup | Subgroup Name | IPR # | Color |
|---|---|---|---|
| 1 | 7-carboxy-7-deazaguanine synthase-like (F) | IPR024924 | Teal |
| 2 | Coproporphyrinogen III oxidase-like (F) | IPR034505 | Red |
| 3 | Antiviral proteins (viperin) (F) | -- | -- |
| 4 | Avilamycin synthase (F) | IPR033971 | Pink |
| 5 | B12-binding domain containing (D) | IPR006158 | Blue |
| 6 | BATS domain containing (D) | IPR010722 | Orange |
| 7 | DesII-like (F) | IPR016863 | Mauve |
| 8 | ELP3/YhcC (F) | IPR039661 | Black |
| 9 | F420, menaquinone cofactor biosynthesis (F) | IPR034405 | Purple |
| 10 | FeMo-cofactor biosynthesis protein (F) | IPR005980 | Mint green |
| 11 | Lipoyl synthase like (F) | IPR003698 | Yellow |
| 12 | Methylthiotransferase (D) | IPR013848 | Verdun green |
| 13 | Methyltransferase Class A (F) | IPR040072 | Dark brown |
| 14 | Methyltransferase Class D (F) | IPR034474 | Light pink |
| 15 | Organic radical activating enzymes (F) | IPR034457 | Cyan |
| 16 | PLP-dependent (F) | IPR003739 | Dark green |
| 17 | SPASM/twitch domain containing (D) | IPR023885 | Magenta |
| 18 | Spectinomycin biosynthesis (F) | IPR034508 | White |
| 19 | Spore photoproduct lyase (F) | IPR023897 | Green |
| 20 | tRNA wybutosine-synthesizing (F) | IPR034556 | Brown |
| Protein MJ0683-like (F) | IPR040086 | Electric lime | |
| Uncharacterized protein family UPF0313 (F) | IPR022946 | Olive | |
| DUF5131 (F) | IPR011101 | Light purple | |
| 3',8-Cyclase/Mo cofactor synthesis (D) | IPR010505 | Dodger blue |
In contrast to the SFLD's SSN (Background tab), the clusters containing the subgroups are not separated in this SSN (a single cluster!), the result of both the larger number of nodes and the choice of a smaller alignment score to both prevent splitting SFLD subgroups into multiple clusters and, also, reduce the number of singletons (the SFLD used an edge threshold of 1e-20).
The SFLD subgroups were separated by selection/deletion of "long" SSN edges ("remote" sequence relationships). This editing is subjective, but we know of no other practical strategy to separate the subgroups. That 1) the nodes associated with the various subgroups colocalize in the starting SSN and 2) their colocalization is maintained in the editing supports the validity of this approach.
In several of the SFLD subgroups, some nodes are grey because they are not recognized by the HMMs used by InterPro (many of the HMMs were generated when the RSS was significantly smaller/less diverse). As a result, the InterPro families (and their HMMs) cannot be used to provide the members of the subgroups.
The nodes associated with either SFLD Subgroup 5, B12-binding domain (blue nodes), or SFLD Subgroup 17, SPASM/Twitch-domain (magenta nodes), are not colocalized in a "spherical", well-organized cluster because the sequence-function space is more diverse than that for the other subgroups. As described in the Functionally Diverse Subgroups tab, RadicalSAM.org provides a strategy to identifying isofunctional clusters in these subgroups.
The resulting "edge-edited" SSN contained 10 clusters, five "megaclusters" containing multiple SFLD subgroups [(mega)clusters are numbered in order of decreasing number of UniRef50 IDs/nodes,1 through 5] and five clusters containing a single SFLD subgroup or InterPro family (numbered in order of decreasing UniRef50 IDs/nodes, 6 through 10).
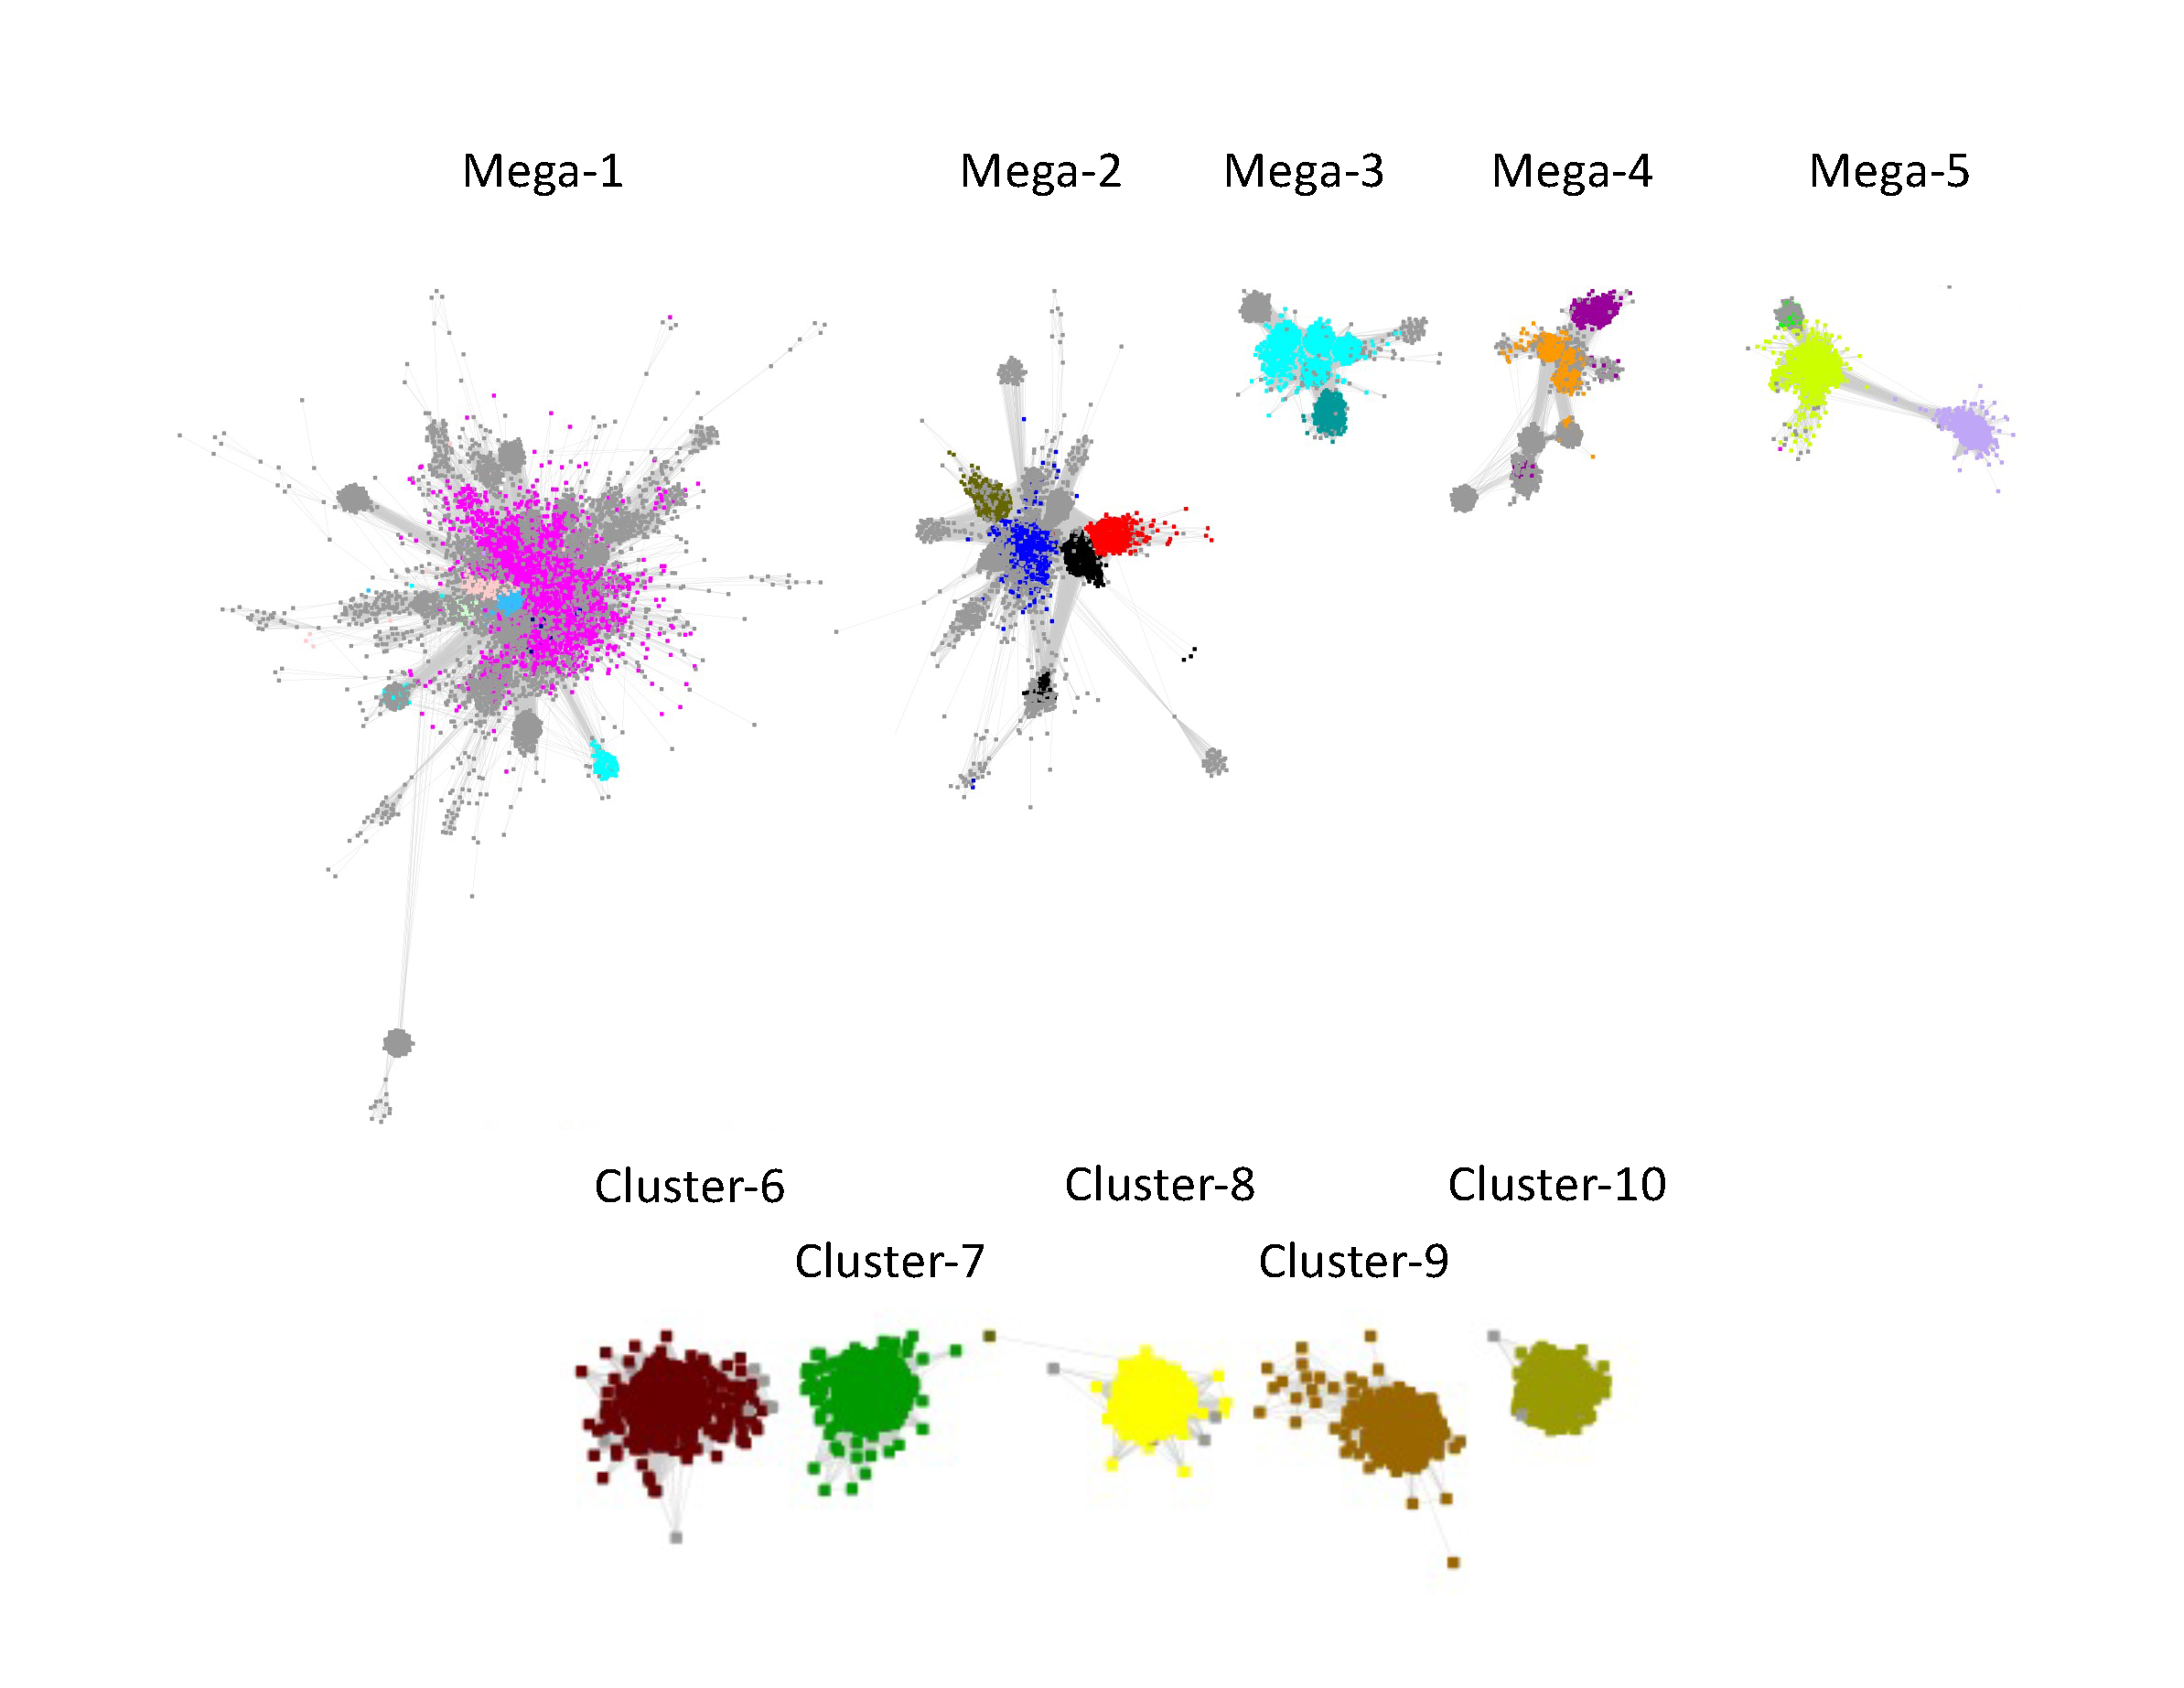
As described in the tabs, Megaclusters-1, -2, -3, -4, and -5 were segregated into component subgroups.
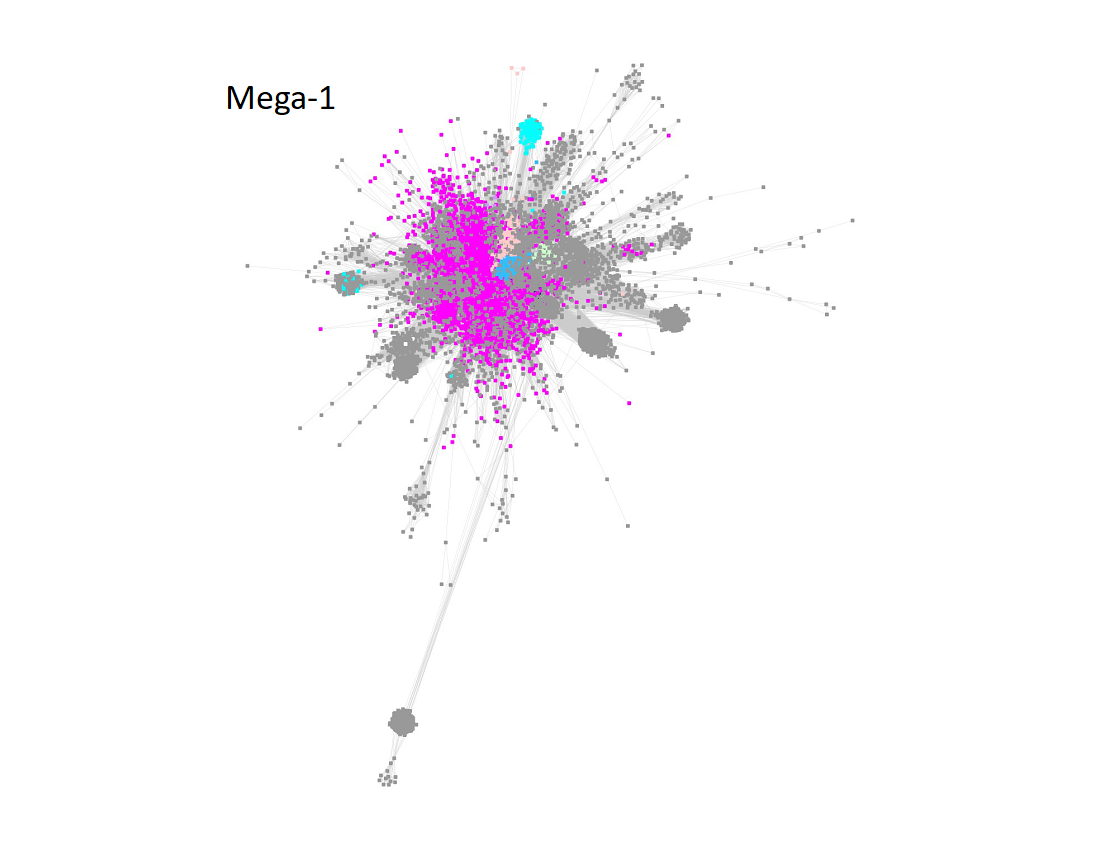
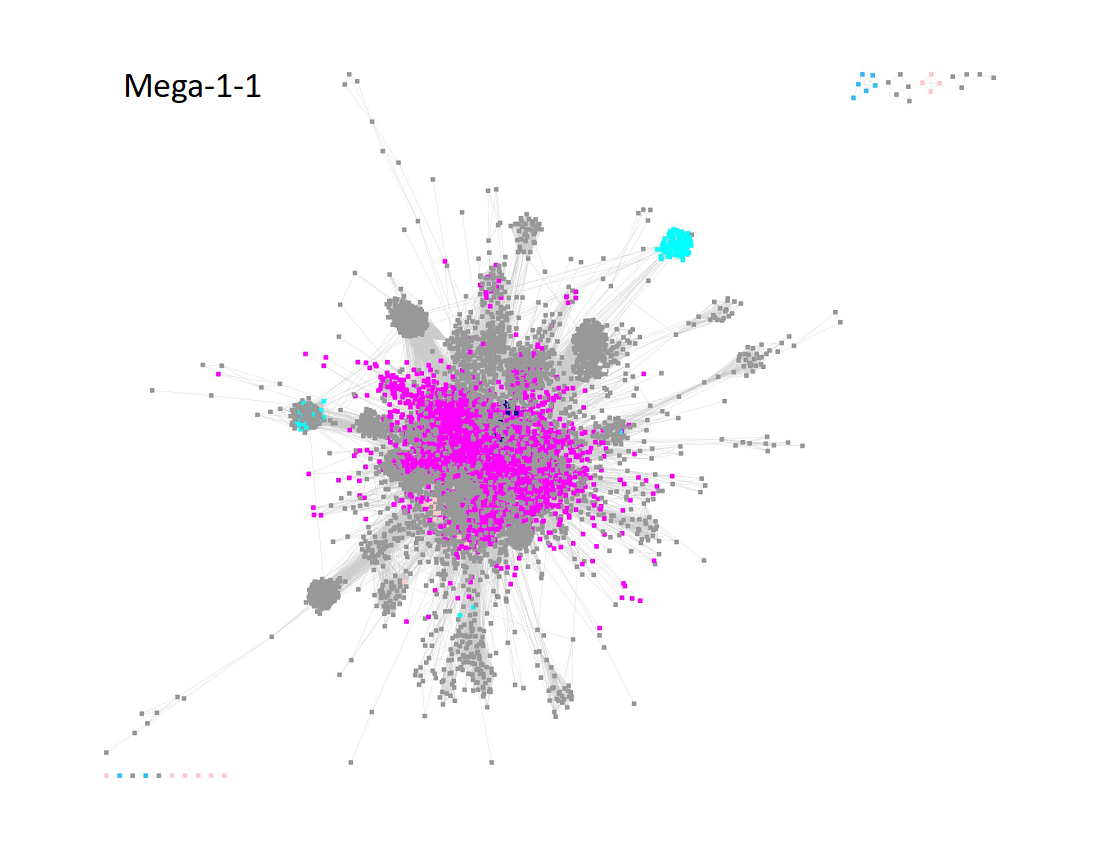
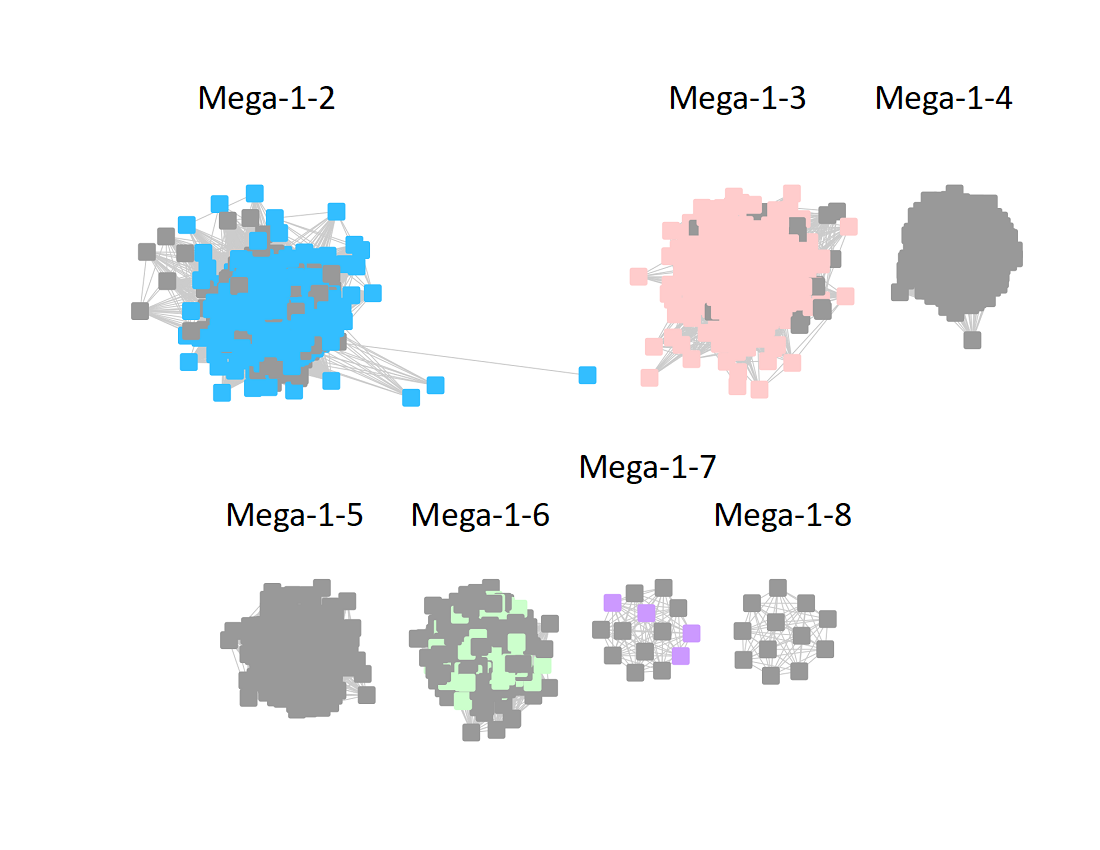
Megacluster-1 also contains the large GTP 3’,8-cyclase family (Megacluster-1-2; "Dodger blue" nodes). The sequences in Megaclusters-1-2, -1-3, -1-4, and 1-5 were identified as discrete clusters in the UniRef50 SSN for Megacluster-1 generated with an alignment score 30; these were removed from Megacluster-1 to generate the SSN for Subgroup 17 (SPASM/Twitch domain; Megacluster-1-1; magenta nodes).
Two uncharacterized clusters "loosely" connected to Megacluster-1 were segregated by manual edge deletion (Megacluster-1-6 and Megacluster-1-7; grey nodes). Megacluster-1-6 contains the SwissProt-curated [methyl-coenzyme M reductase subunit alpha]-arginine C-methyltransferase function.
The UniRef50 SSN for the resulting Megacluster-1-1 using an aligment score of 11 is displayed below.
The UniRef50 SSN for Megacluster-1-2 through Megacluster-1-8 is displayed below. The clusters are numbered in order of decreasing number of UniRef50 nodes.
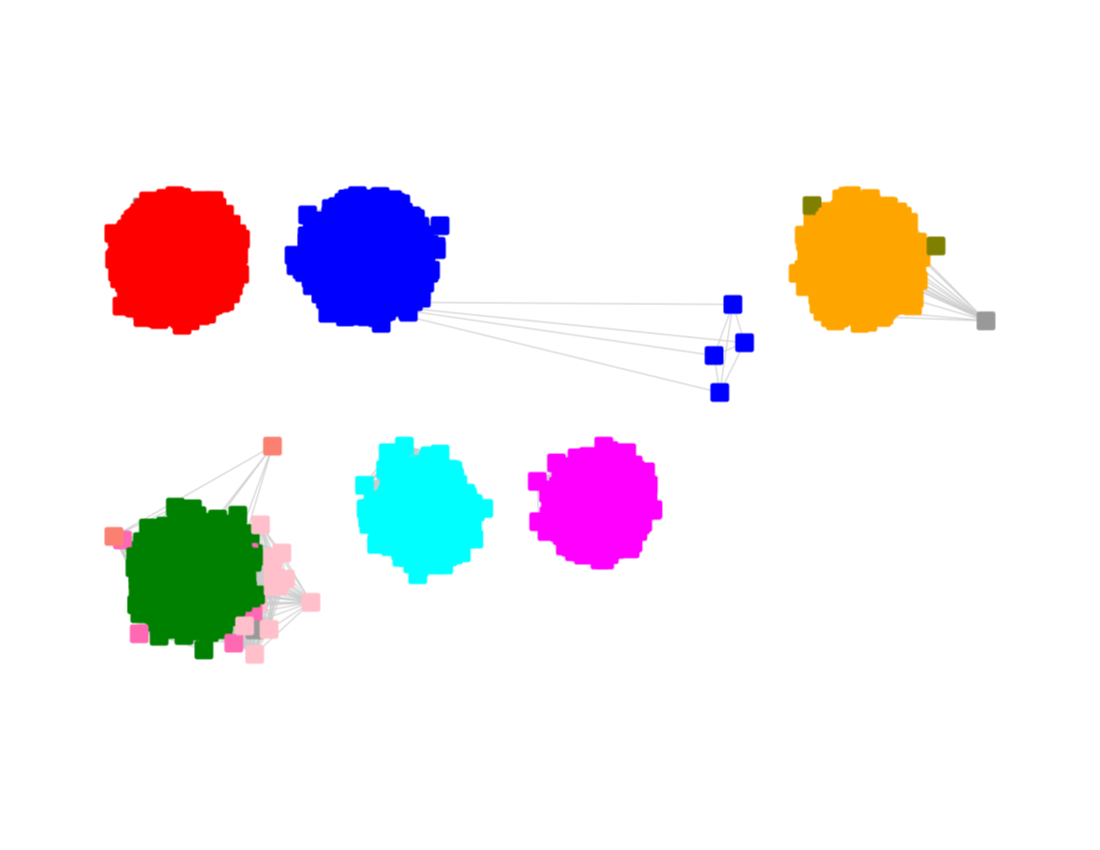
Megacluster-2 contains four SFLD subgroups: Subgroup 5 (B12-binding domain, Megacluster-2-1, blue nodes); Subgroup 2 (Coproporphyrinogen III oxidase-like, Megacluster-2-2, red nodes), Subgroup 12 (Methylthiotransferase, Megacluster-2-3, Verdun green nodes); and Subgroup 8 (Elongator protein 3, Megaclusters-2-4 and -2-5, black nodes).
The UniRef50 SSN for Megacluster-2 was generated with an alignment score of 11.
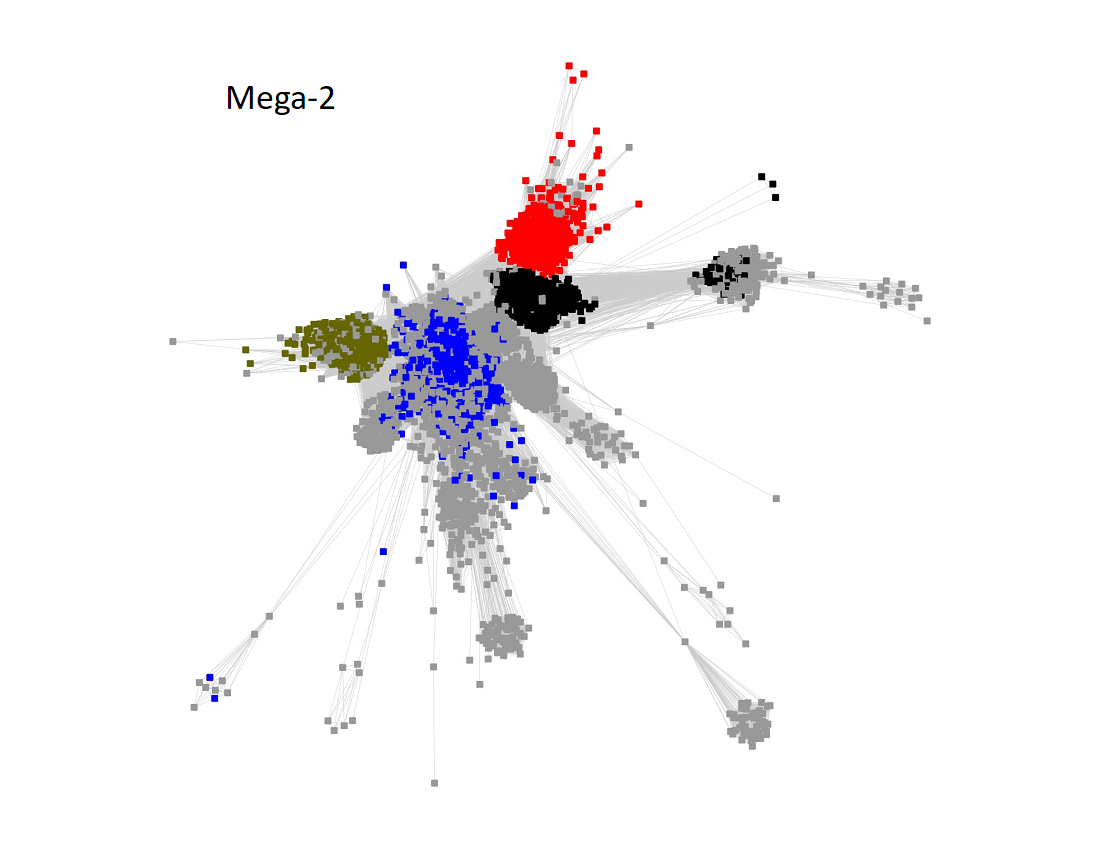
Long edges were deleted to segregate the clusters/subgroups.
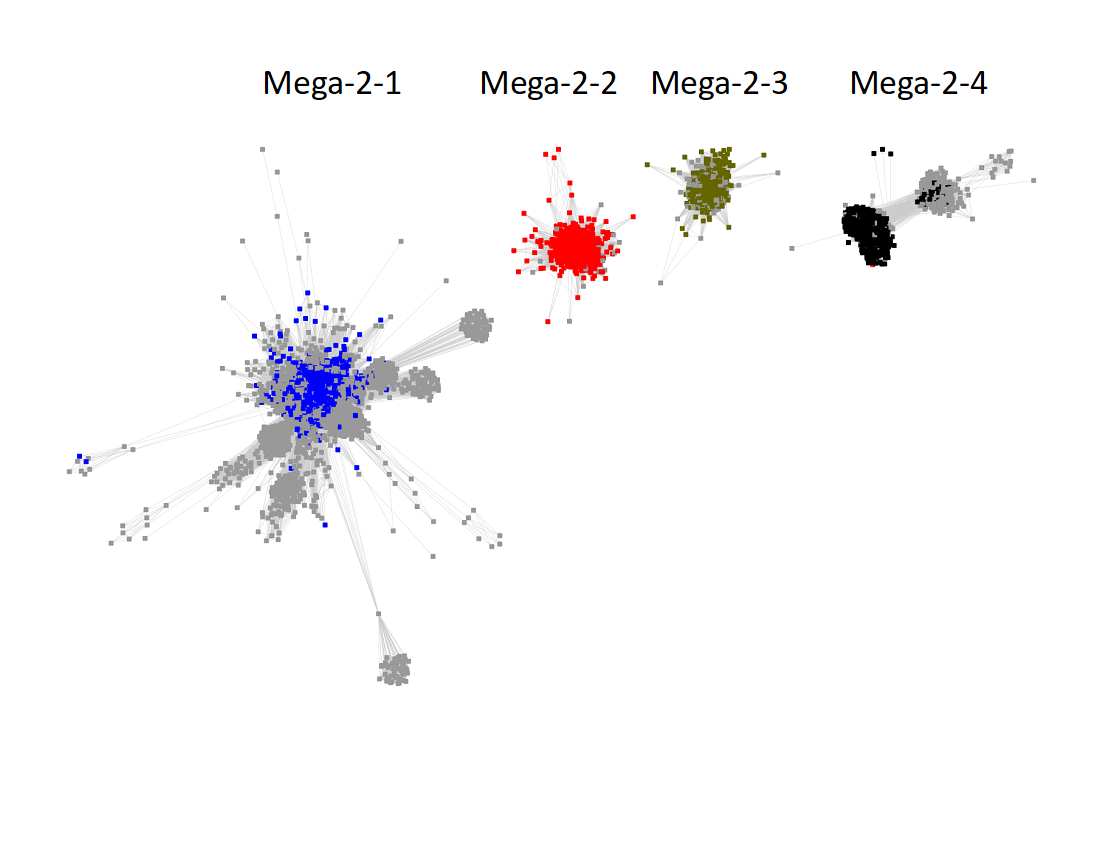
The subgroups are numbered in order of decreasing number of UniRef50 nodes.
The UniRef90 SSN for Megacluster-2-4 was generated with an alignment score of 27.
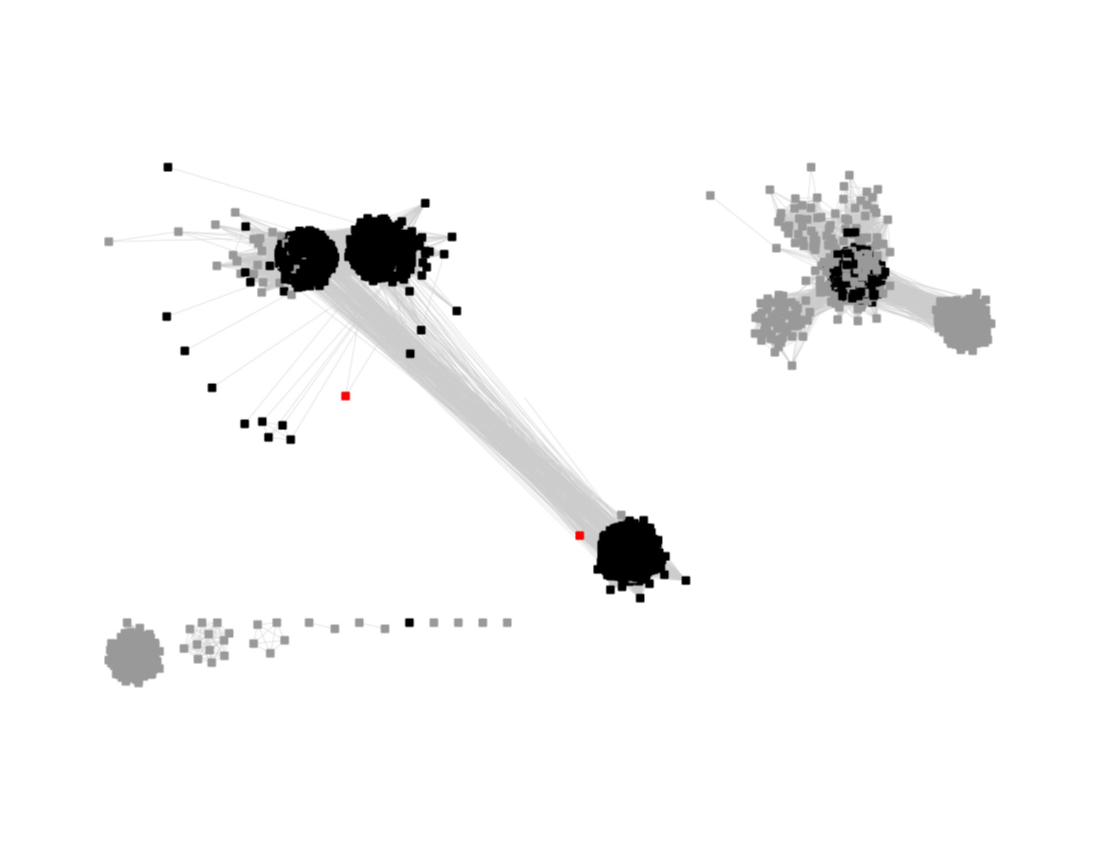
"Long" edges were deleted to segregate the subgroups.
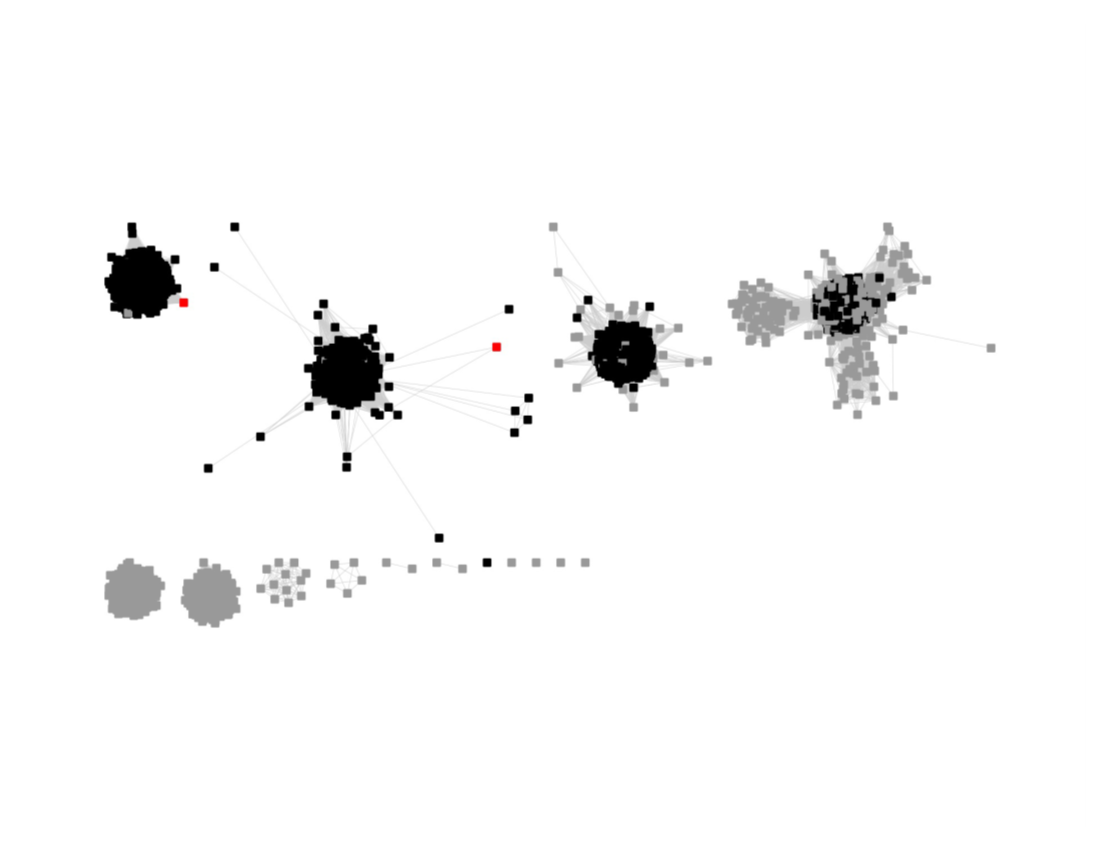
This SSN was submitted to the Color SSN utility; the Color Mapping file was used with BridgeDb in Cytoscape to identify the six major clusters in the SSN generated with an alignment score of 11.
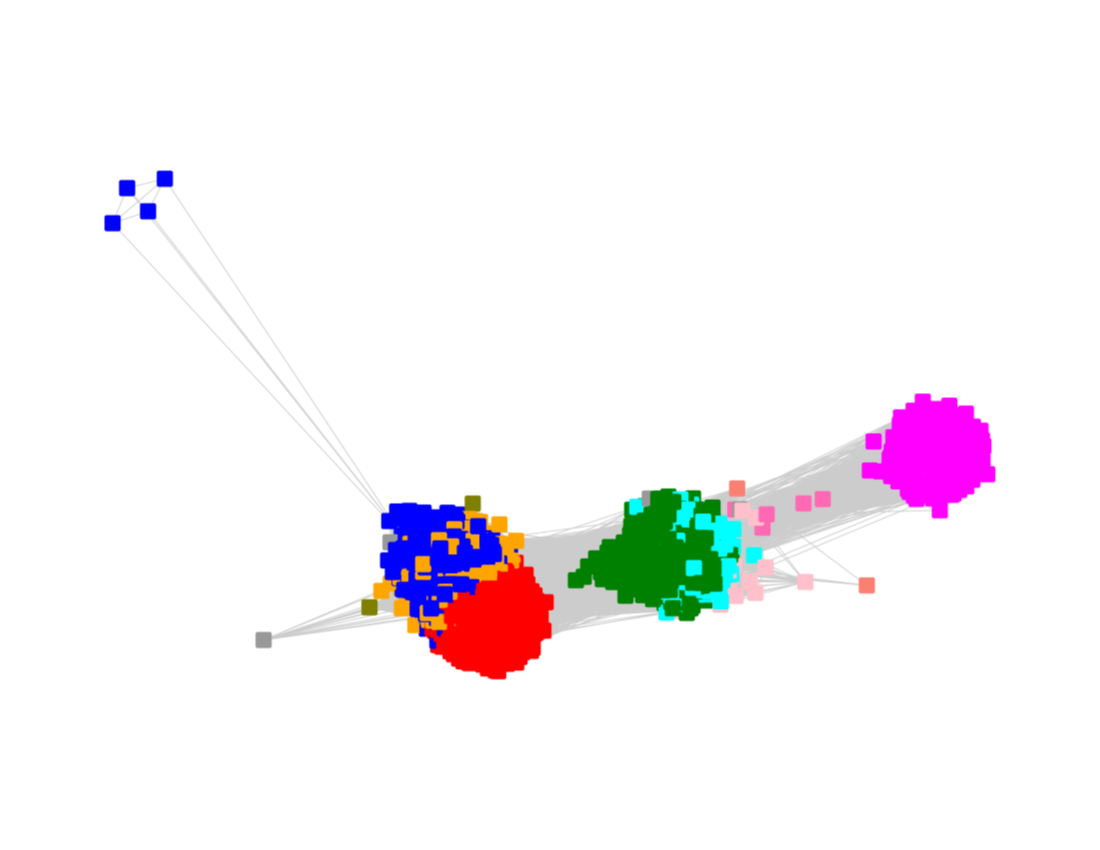
The nodes were segregated into six subgroups by selecting the colors associated with the major nodes in the segregated AS27 SSN and moving them to allow deletion of the connecting edges; the nodes with other colors were merged with the "closest" major subgroup.
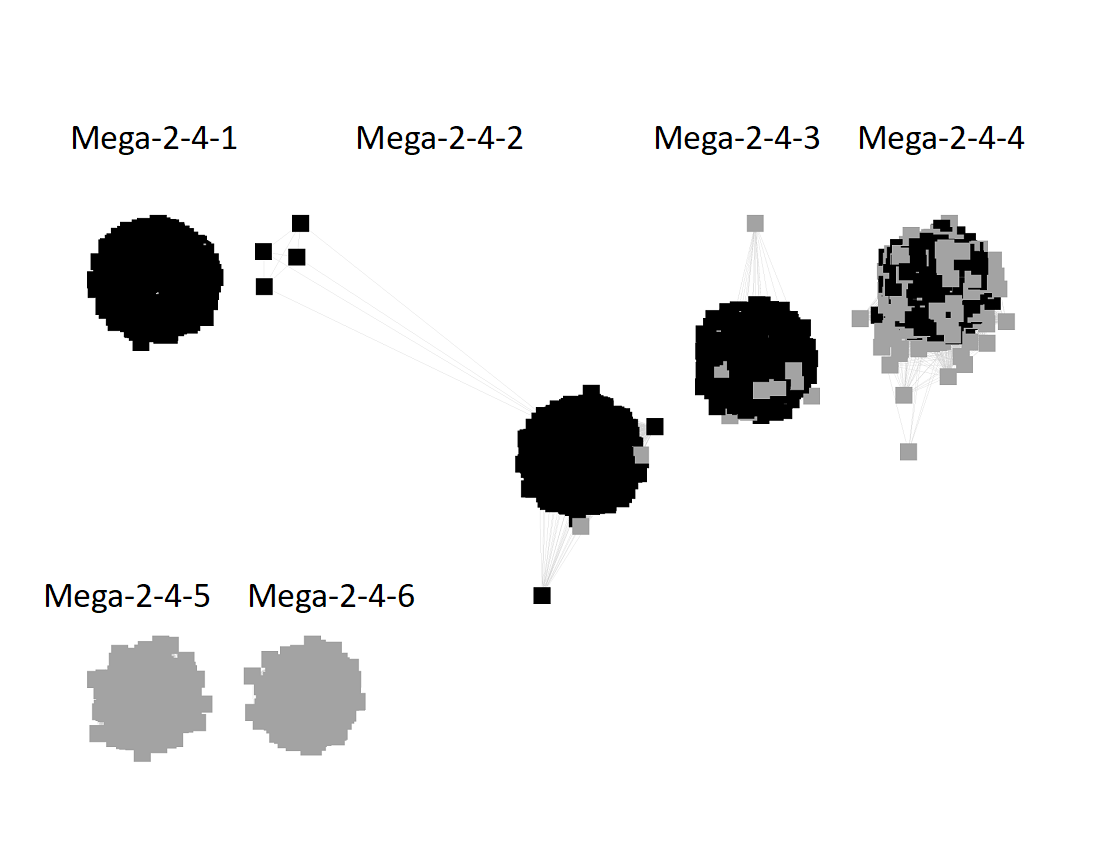
The subgroups are numbered in order of decreasing number of UniRef90 nodes.
Megacluster-3 contains two SFLD subgroups: Subgroup 1 (7-carboxy-7-deazaguanine synthase-like, Megacluster-3-1, teal nodes) and Subgroup 2 (Organic radical activating enzymes, Megacluster-3-2; cyan nodes).
The UniRef90 IDs in Megacluster-3 were used to generate the SSN with an alignment score of 18.
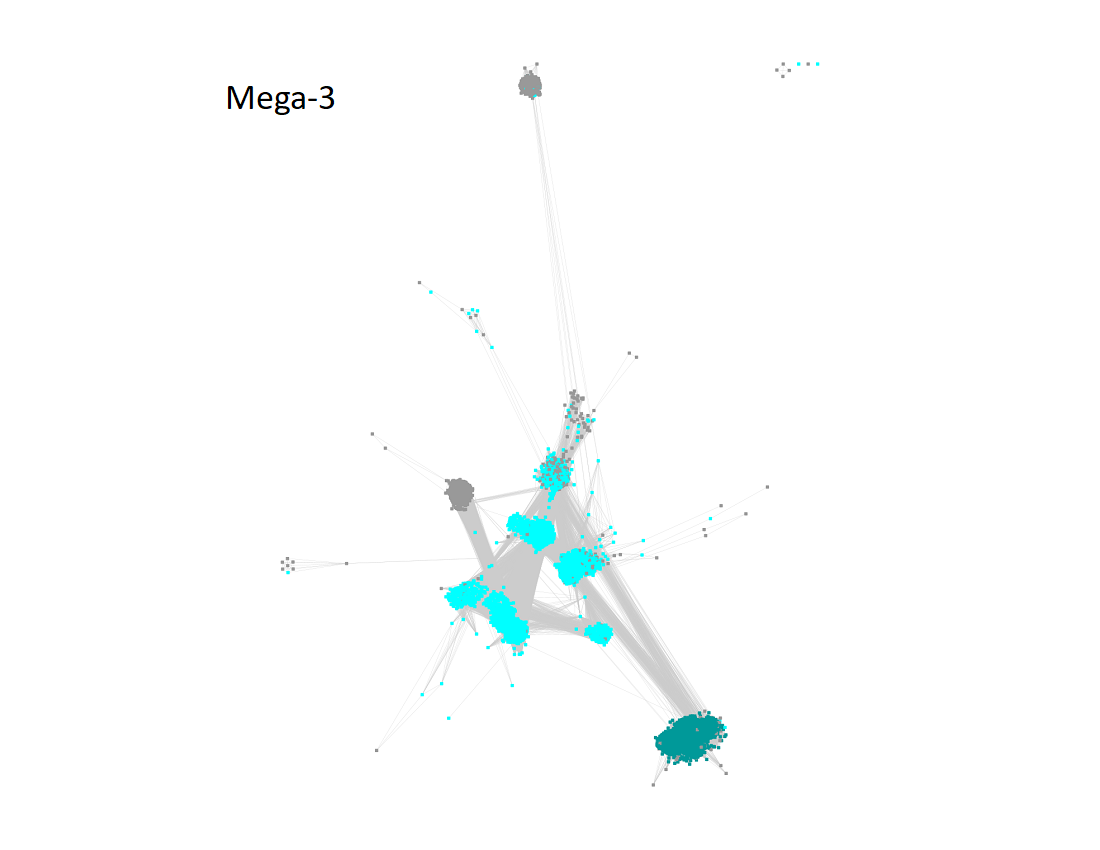
"Long" edges were deleted to segregate the subgroups.
The subgroups are numbered in order of decreasing number of UniRef90 IDs/nodes.
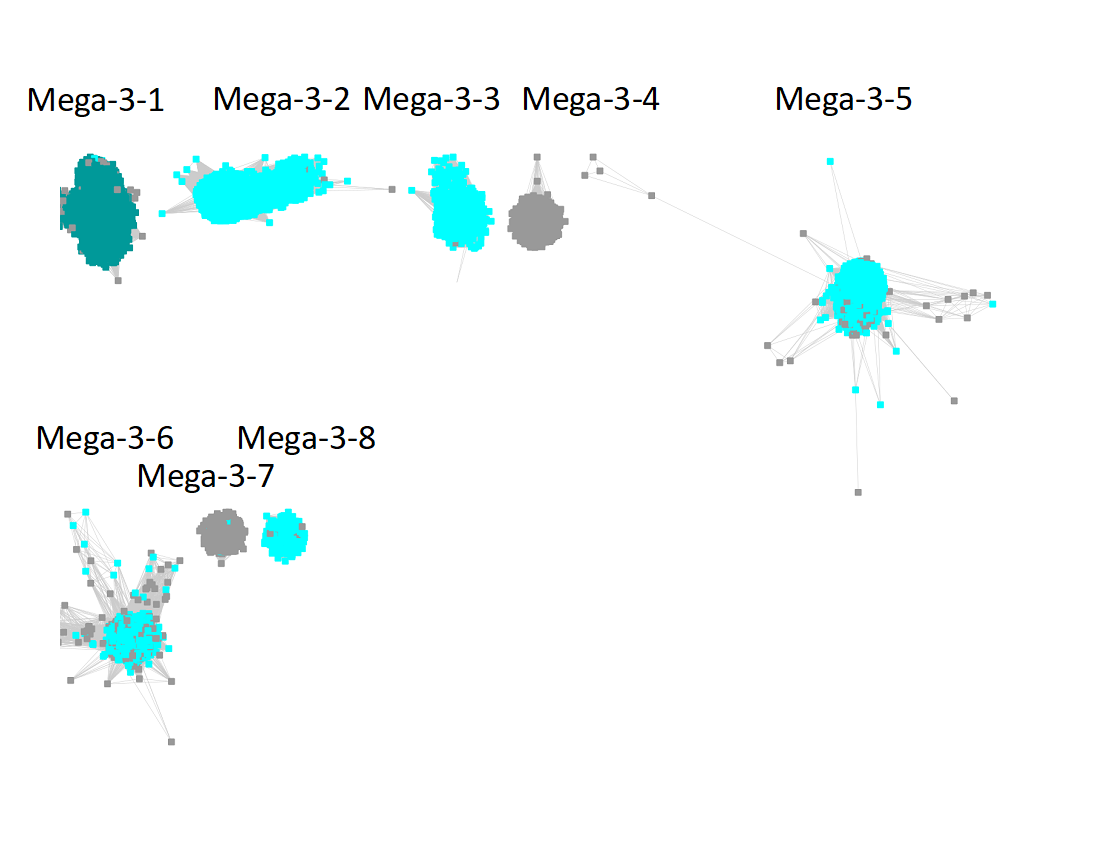
The UniRef90 SSN for Megacluster-3-2 was generated with an alignment score of 30. "Long" edges were deleted to segregate the subgroups.
Following the strategy described for segregating the subgroups in Megacluster-2-4, the segregated SSN was submitted to the Color SSN utility, the nodes in the SSN for Megacluster-3-2 generated with an alignment score of 18 were colored; the nodes associated with each of the six subgroups were moved so that the subgroups could be segregated.
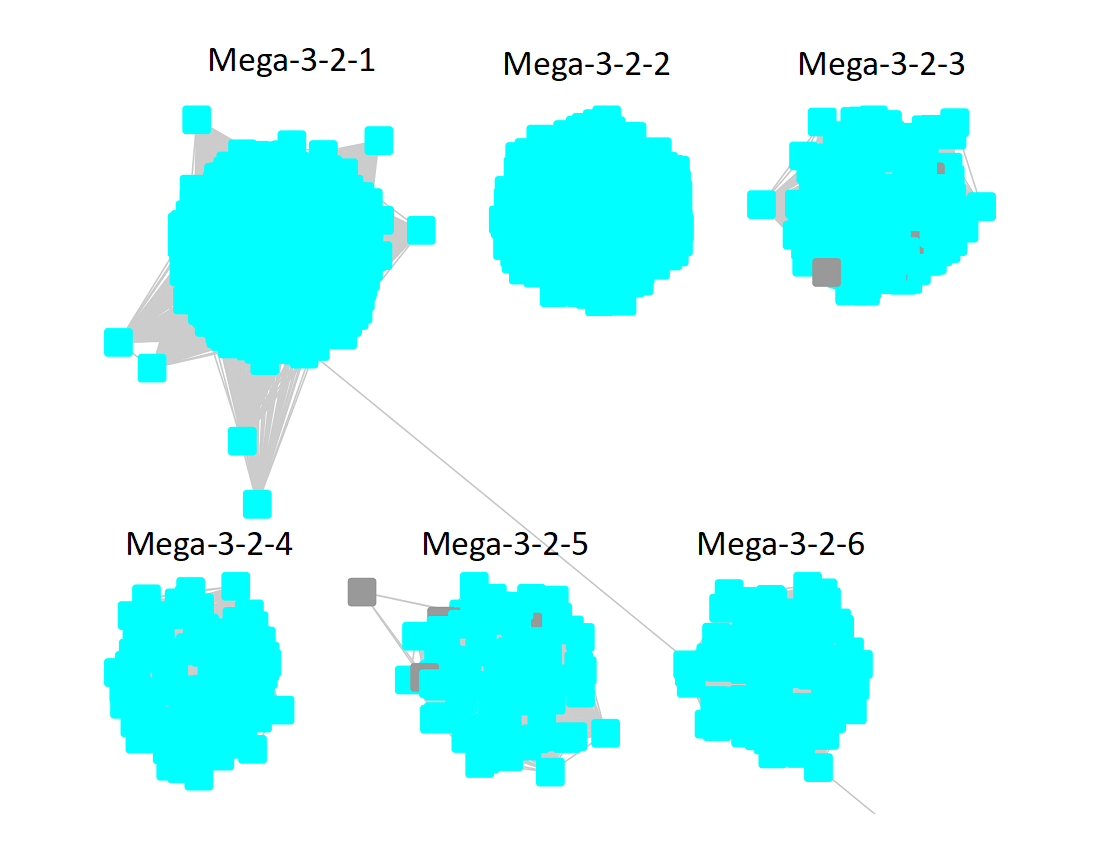
The subgroups are numbered in order of decreasing number of UniRef90 IDs/nodes.
The UniRef90 SSN for Megacluster-3-3 was generated with an alignment score of 45. "Long" edges were deleted to segregate the subgroups.
Following the strategy described for segregating the subgroups in Megacluster-2-4, the segregated SSN was submitted to the Color SSN utility, the nodes in the SSN for Megacluster-3-3 generated with an alignment score of 18 were colored; the nodes associated with each of the seven subgroups were moved so that the subgroups could be segregated.
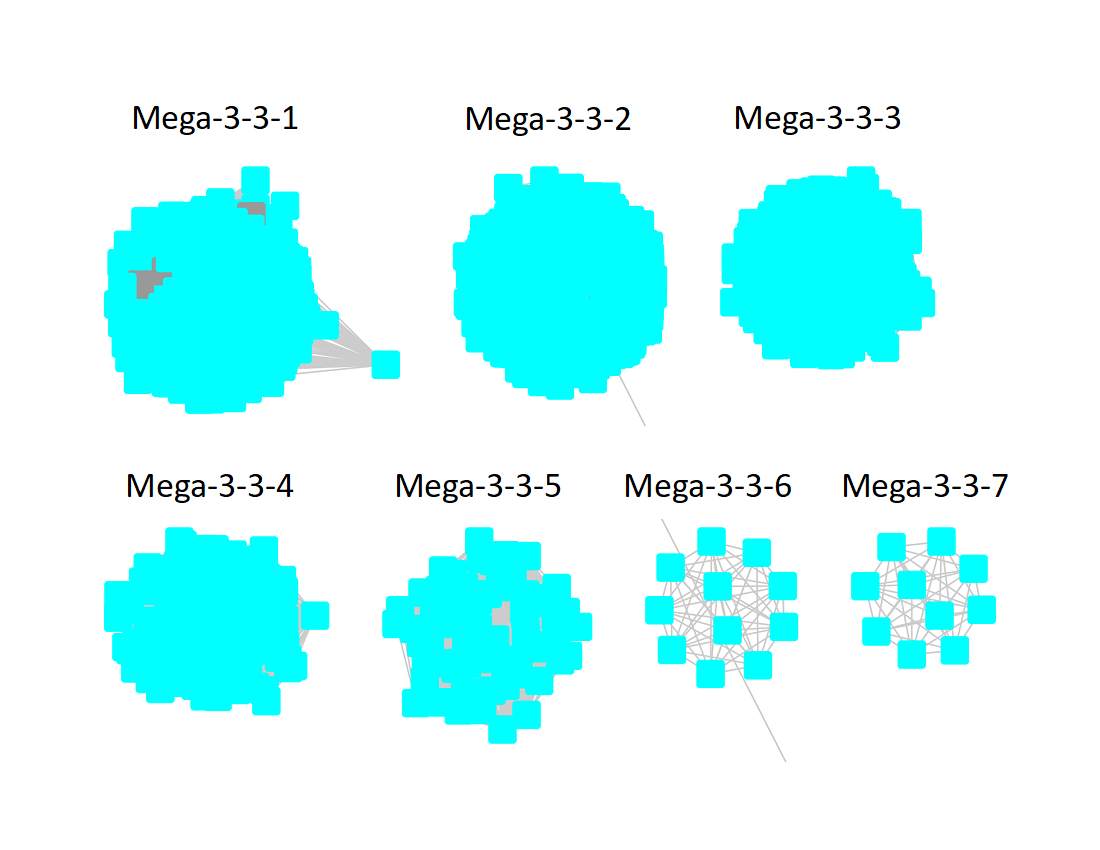
The subgroups are numbered in order of decreasing number of UniRef90 nodes.
The UniRef90 SSN for Megacluster-3-4 was generated with an alignment score of 50. "Long" edges were deleted to segregate the subgroups.
Following the strategy described for segregating the subgroups in Megacluster-2-4, the segregated SSN was submitted to the Color SSN utility, the nodes in the SSN for Megacluster-3-4 generated with an alignment score of 18 were colored; the nodes associated with the two subgroups were moved so that the subgroups could be segregated.
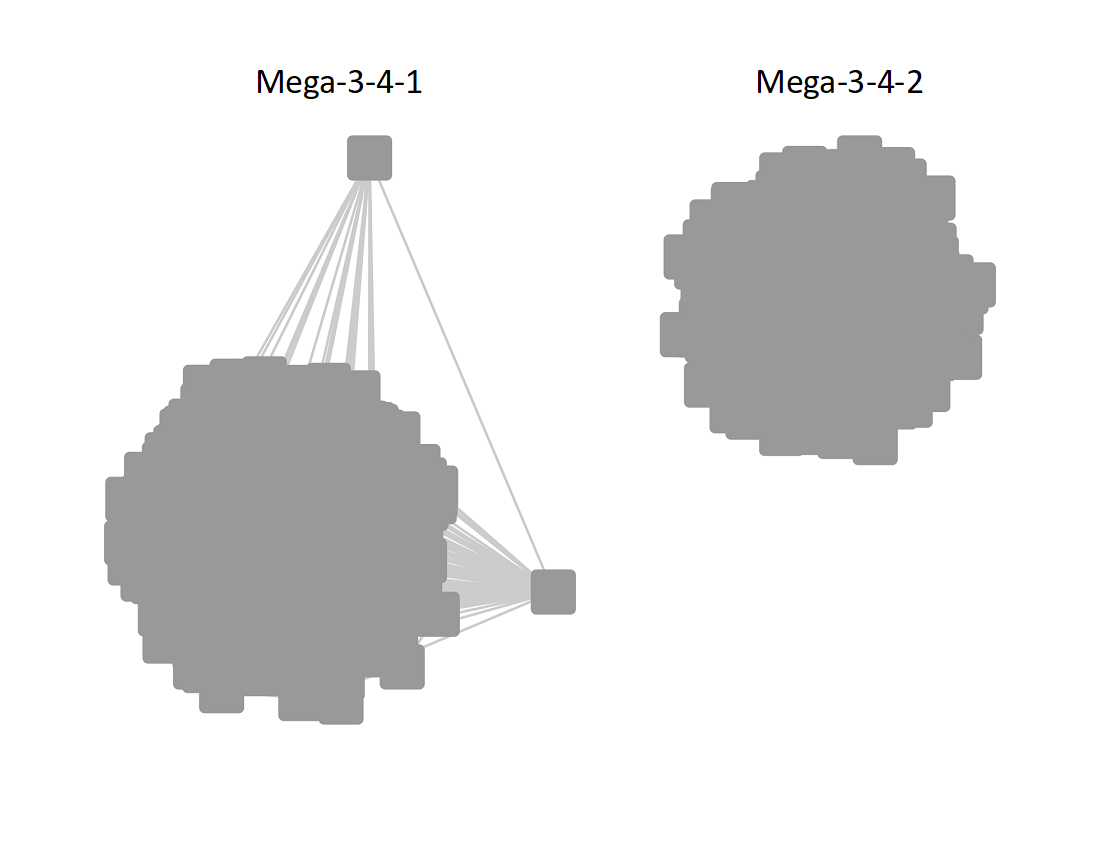
The subgroups are numbered in order of decreasing number of UniRef90 nodes.
Megacluster-4 contains two SFLD subgroups: Subgroup 10 (F420, menaquinone cofactor biosynthesis, Megaclusters-4-1 and -4-6; purple nodes) and Subgroup 6 (BATS domain containing, Megaclusters-4-2, -4-3, -4-5, -4-7, -4-10, and -4-11, orange nodes).
The UniRef90 IDs in Megacluster-4 were used to generate the SSN with an alignment score of 22.
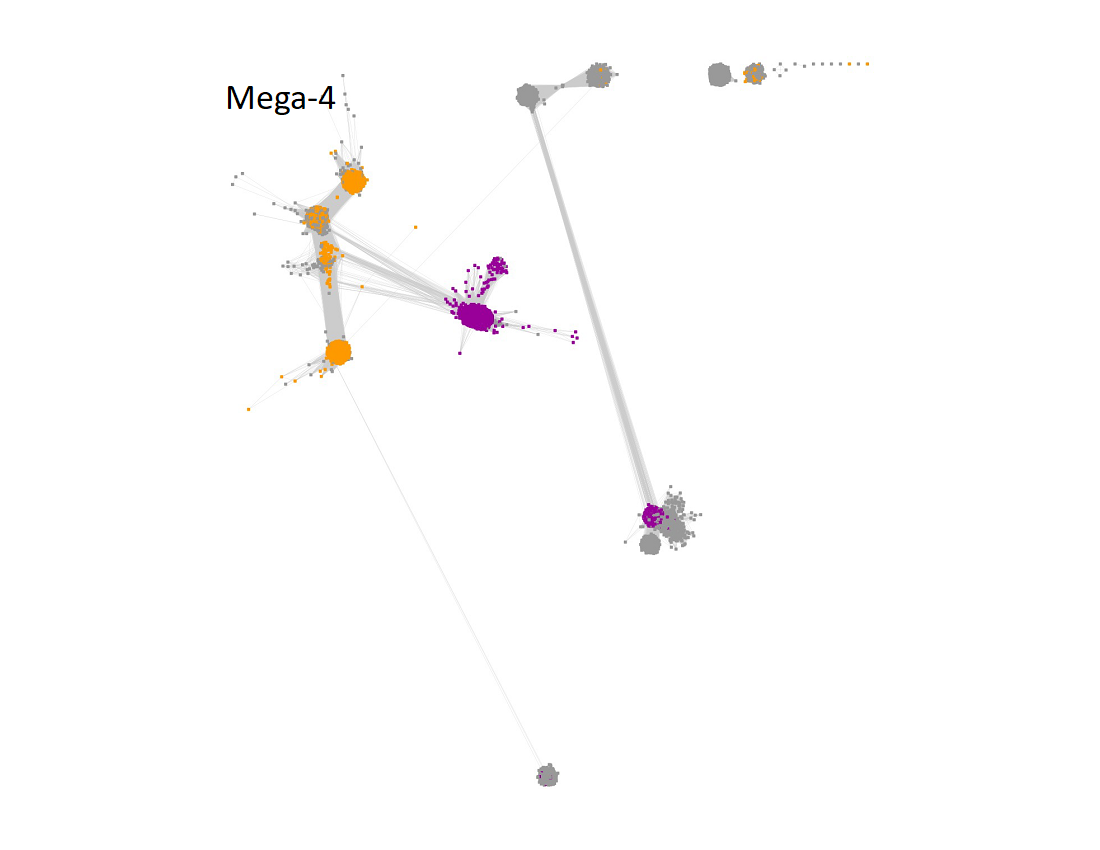
"Long" edges were deleted to segregate the clusters/subgroups.
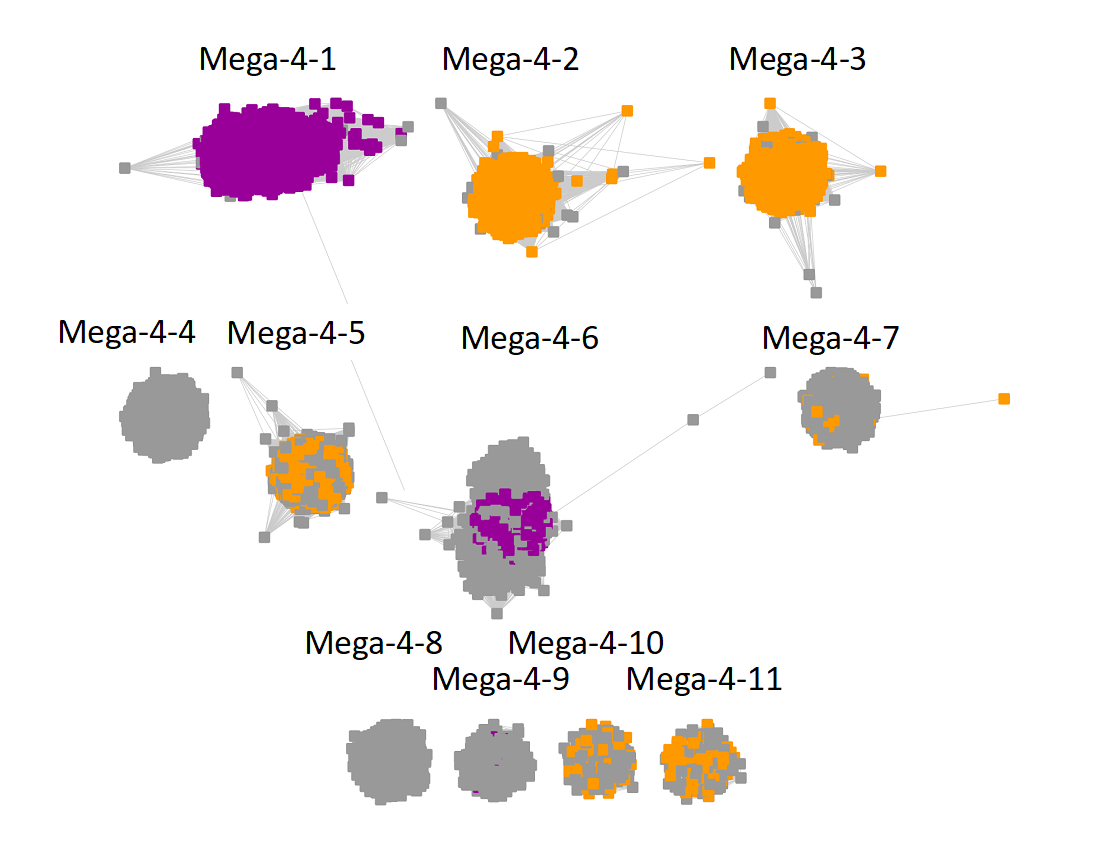
The subgroups are numbered in order of decreasing number of UniRef90 IDs/nodes.
Two UniRef90 SSNs for Megacluster-4-1 were generated using a maximum of 250 BLAST hits for each query sequence and an alignment score of 22.
1) Minimum length of 140 residues and maximum length of 600 residues:
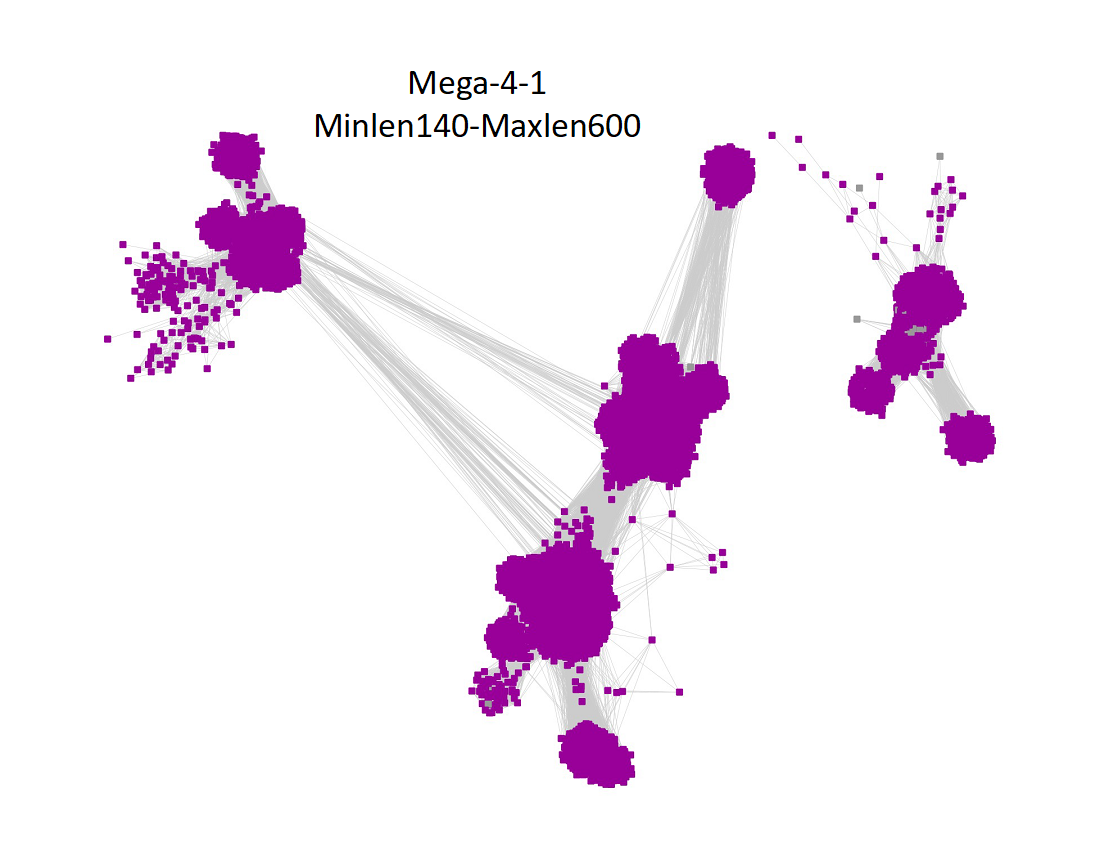
"Long" edges were deleted to segregate the clusters/subgroups.
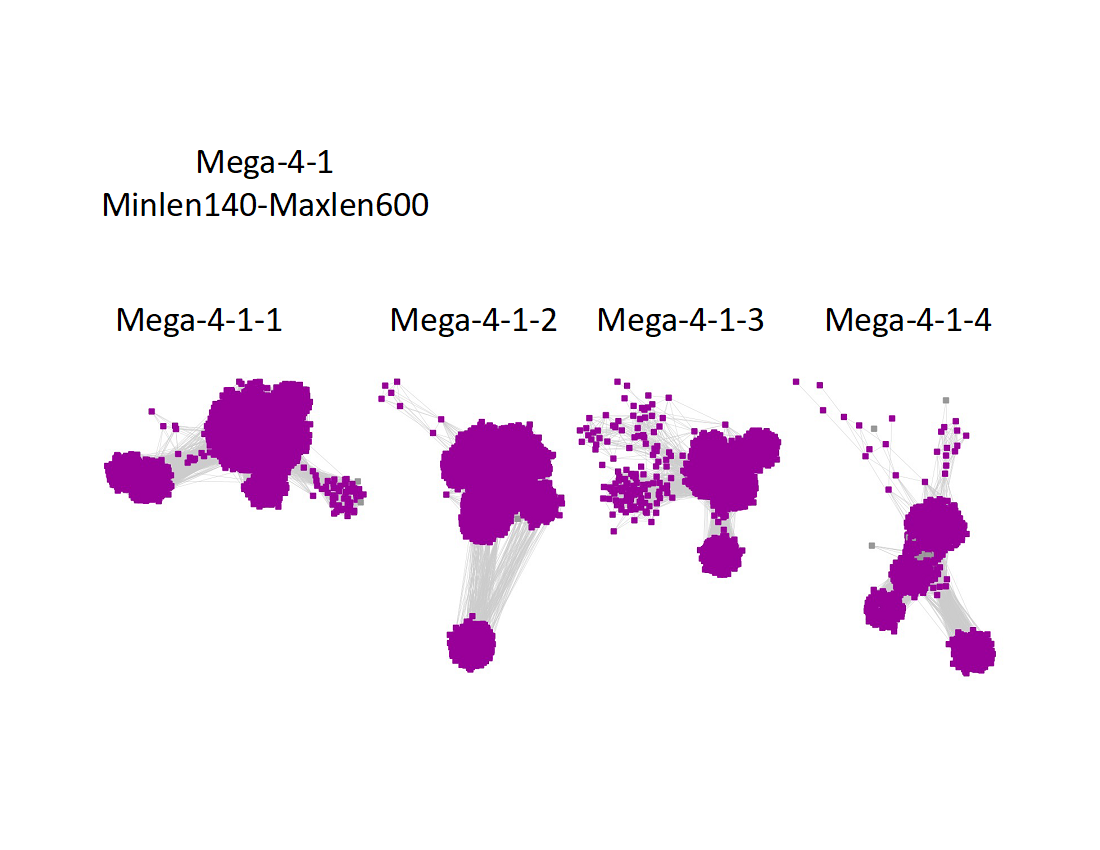
The subgroups are numbered in order of decreasing number of UniRef90 nodes.
2) Minimum length of 601 residues:
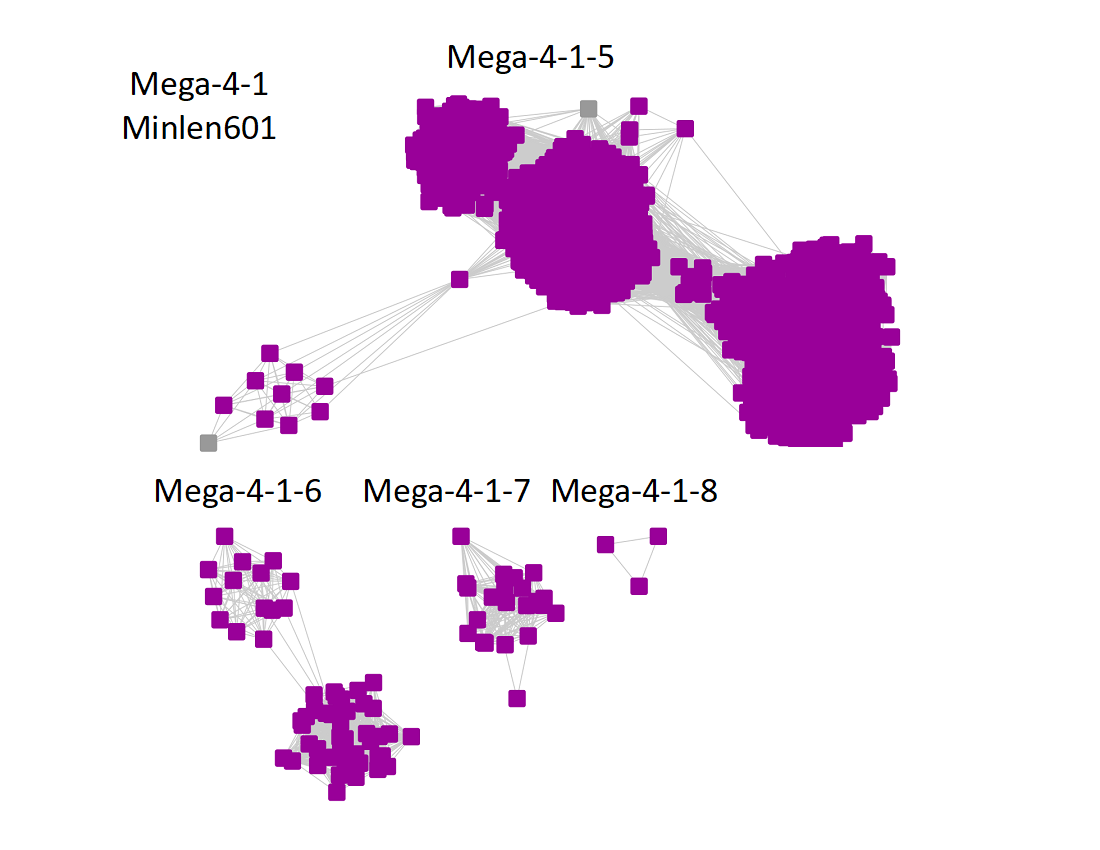
The additional subgroups are numbered in order of decreasing number of UniRef90 IDs/nodes.
The UniRef90 SSN for Megacluster 4-2 was generated with an alignment score of 60. "Long" edges were deleted to segregate the clusters/subgroups.
Following the strategy described for segregating the subgroups in Megacluster-2-4, the segregated SSN was submitted to the Color SSN utility, the nodes in the SSN for Megacluster-4-2 generated with an alignment score of 22 were colored; the nodes associated with each of the three subgroups were moved so that the subgroups could be segregated.
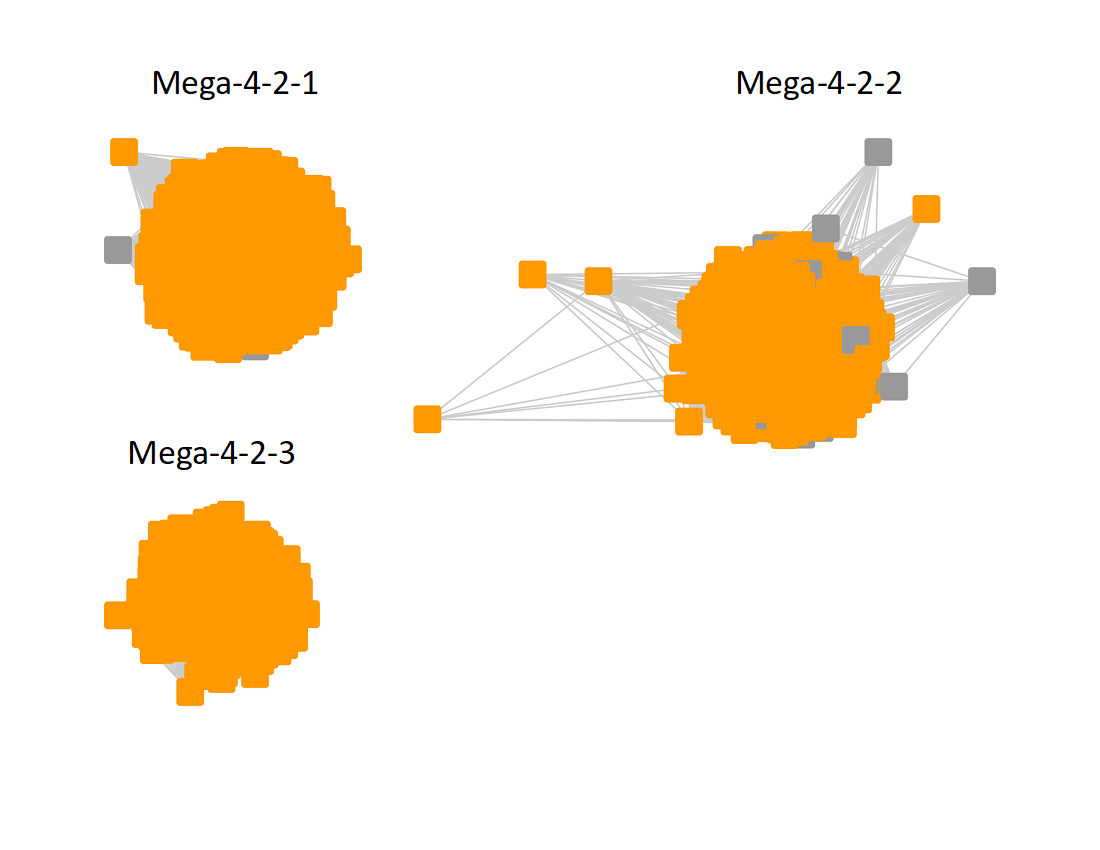
The subgroups are numbered in order of decreasing number of UniRef90 nodes.
The UniRef90 SSN for Megacluster-4-3 was generated using a maximum of 150 BLAST hits for each query sequence and an alignment score of 22.
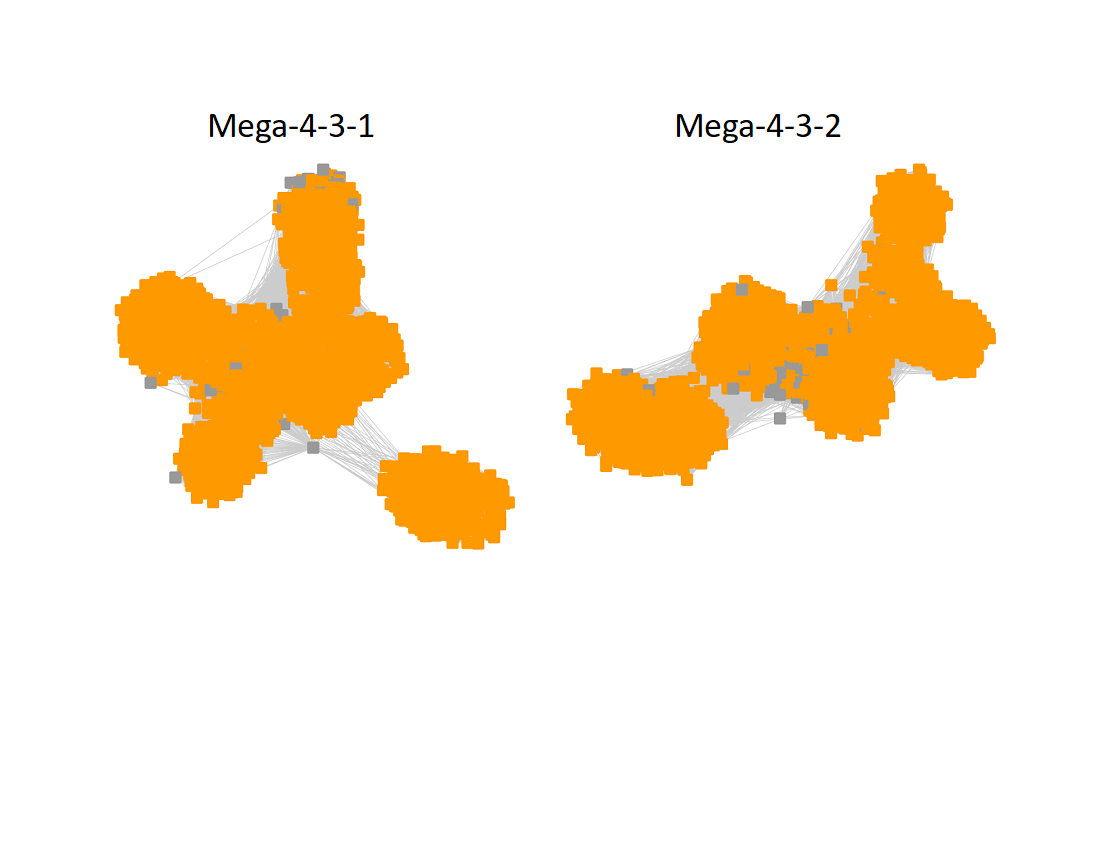
The subgroups are numbered in order of decreasing number of UniRef90 nodes.
The UniRef90 SSN for Megacluster-4-5 was generated with an alignment score of 40. "Long" edges were deleted to segregate the clusters/subgroups.
Following the strategy described for segregating the subgroups in Megacluster-2-4, the segregated SSN was submitted to the Color SSN utility, the nodes in the SSN for Megacluster-4-5 generated with an alignment score of 22 were colored; the nodes associated with each of the subgroups were moved so that the subgroups could be segregated.
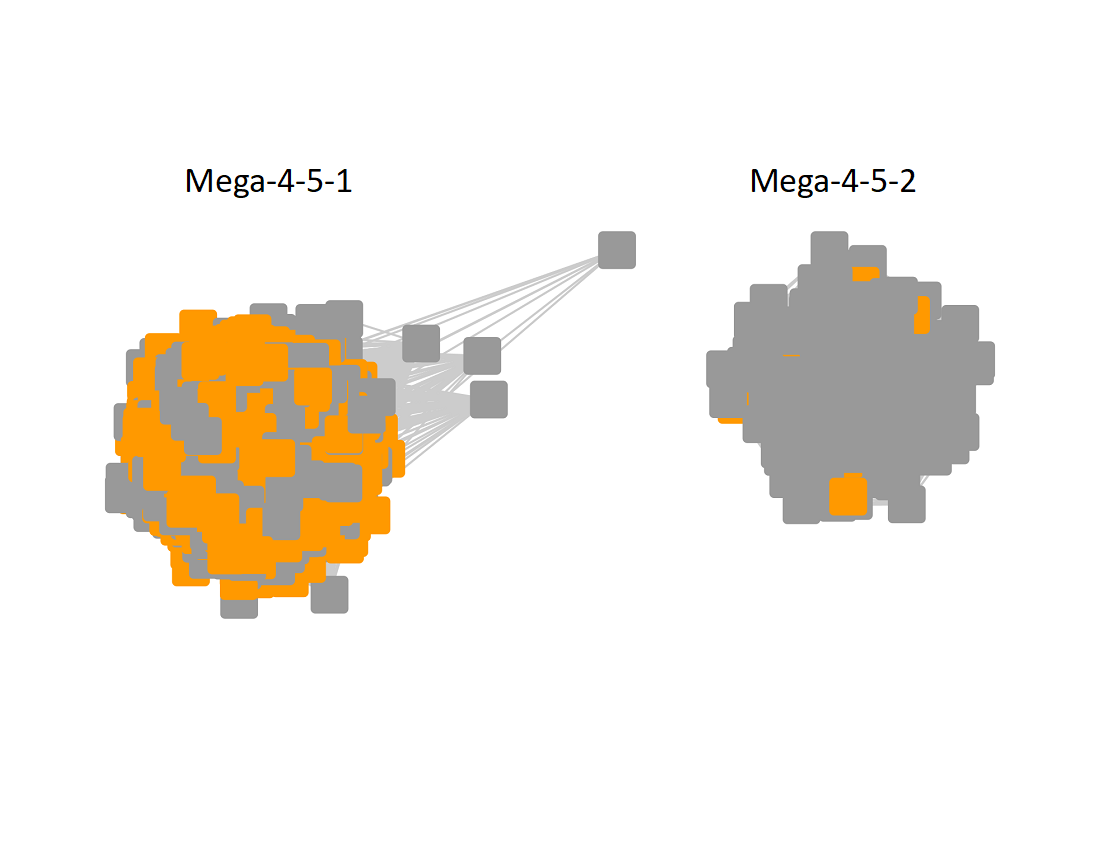
The subgroups are numbered in order of decreasing number of UniRef90 nodes.
The UniRef90 SSN for Megacluster-4-6 was generated with an alignment score of 32. "Long" edges were deleted to segregate the clusters/subgroups.
Following the strategy described for segregating the subgroups in Megacluster-2-4, the segregated SSN was submitted to the Color SSN utility, the nodes in the SSN for Megacluster-4-6 generated with an alignment score of 22 were colored; the nodes associated with each of the six subgroups were moved so that the subgroups could be segregated.
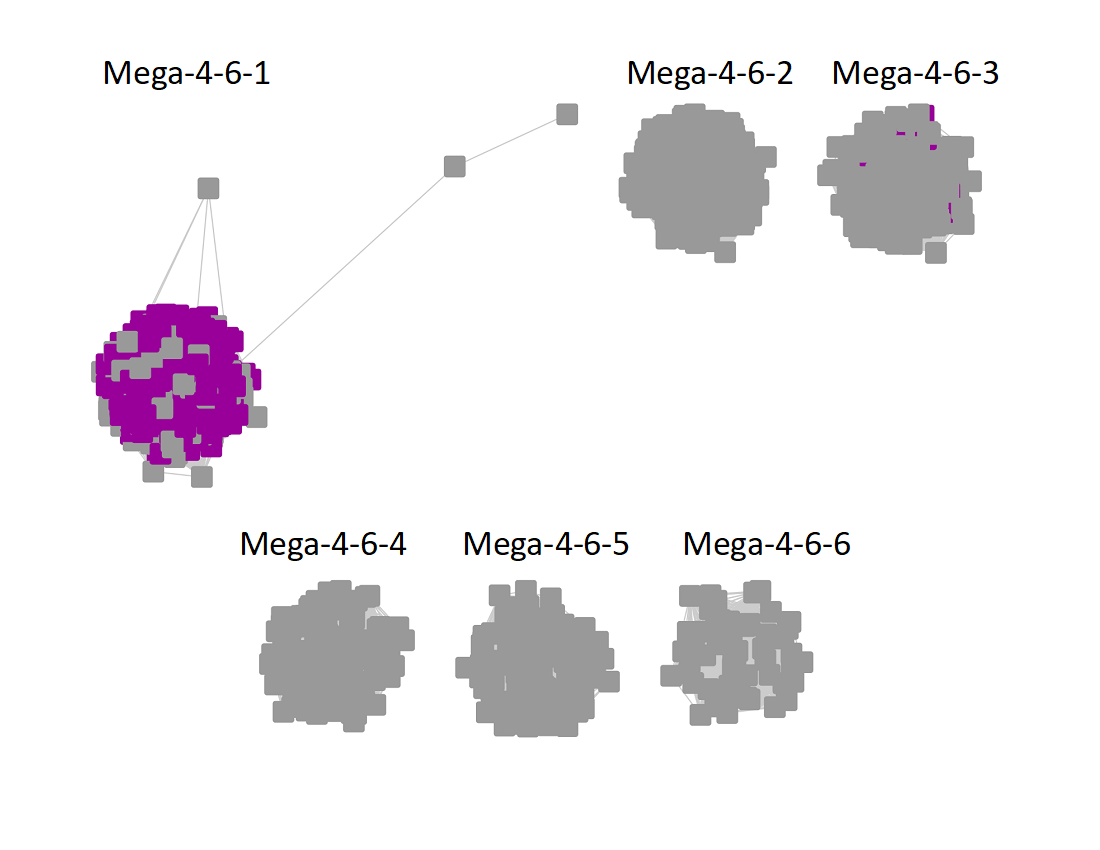
The subgroups are numbered in order of decreasing number of UniRef90 nodes.
Megacluster-5 contains one SFLD subgroup and two additional InterPro families: Protein MJ0683-like (Megacluster-5-1, electric lime nodes); DUF5131 (Megacluster-5-2; light purple nodes), and Subgroup 19 (Spore photoproduct lyase, Megacluster-5-3, green nodes).
The UniRef90 SSN for Megacluster-5 was generated with an alignment score of 13.
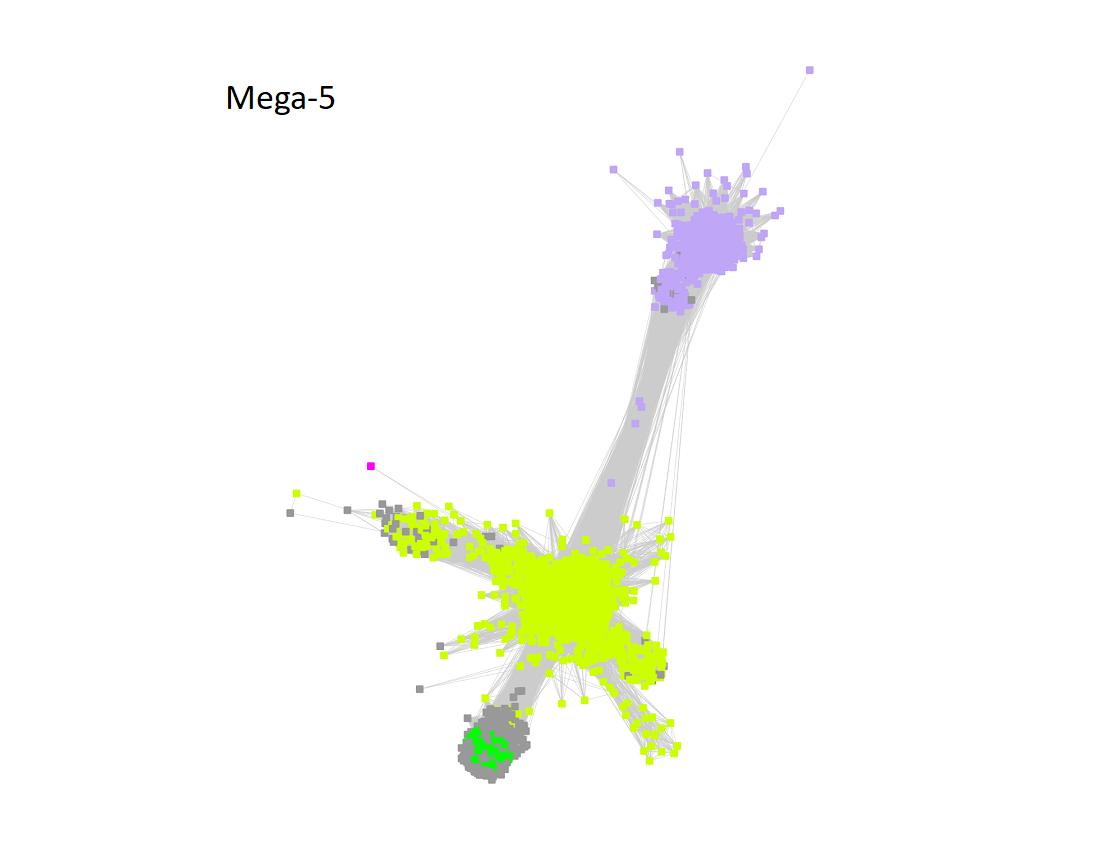
"Long" edges were deleted to segregate the clusters/subgroups.
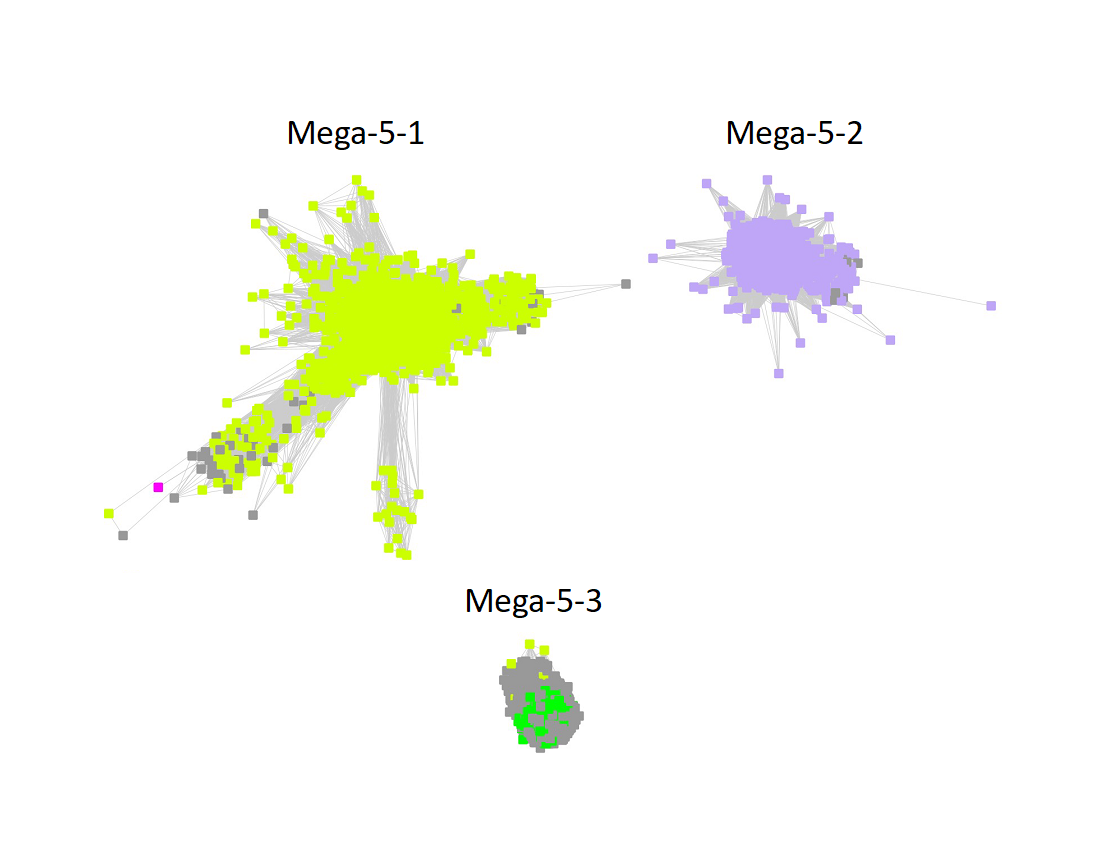
The subgroups are numbered in order of decreasing number of UniRef90 IDs/nodes.
The UniRef90 SSN for Megacluster-5-3 was generated with an alignment score of 32. "Long" edges were deleted to segregate the clusters/subgroups.
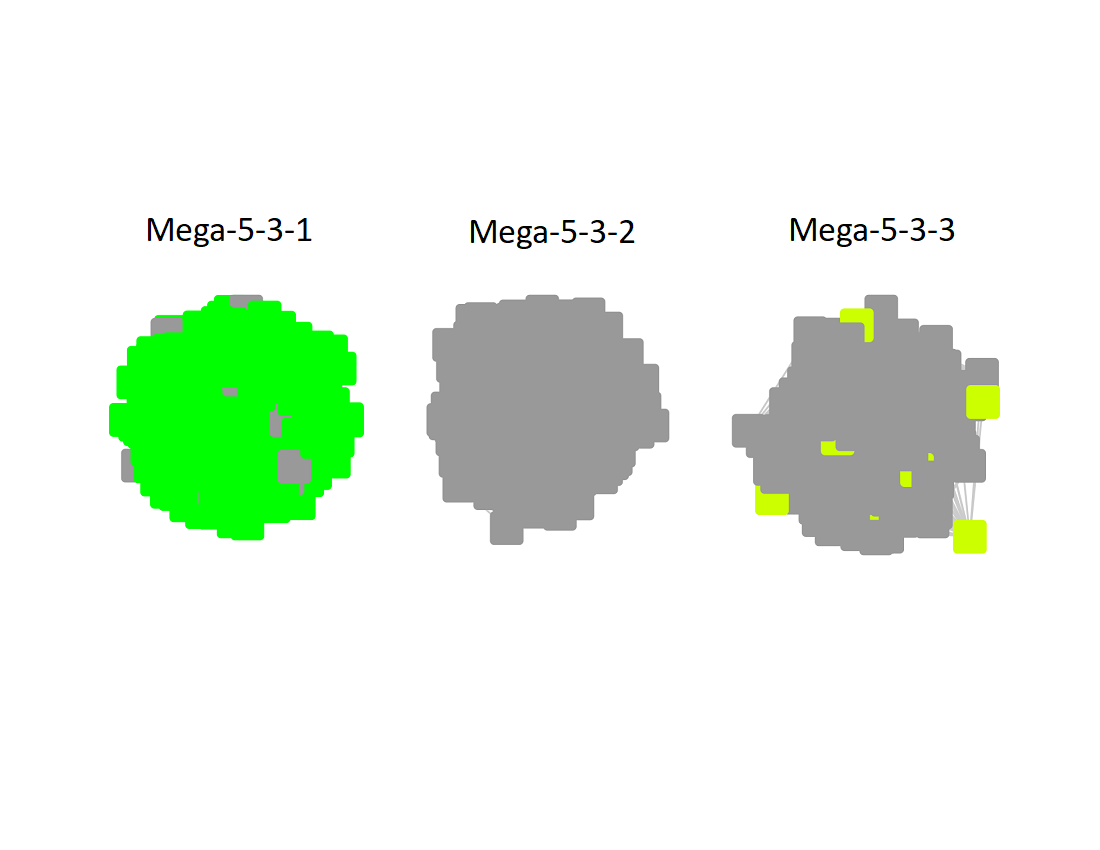
The subgroups are numbered in order of decreasing number of UniRef90 nodes.
Four clusters in the RSS UniRef50 SSN contained one SFLD subgroup and the fifth contained one InterPro family: Subgroup 13 (Methyltransferase Class A, Cluster-6, dark brown nodes); Subgroup 16 (PLP-dependent, Cluster-7, dark green nodes); Subgroup 11 (Lipoyl synthase like, Cluster-8, yellow nodes); Subgroup 19 (tRNA wybutosine-synthesizing, Cluster-9, brown nodes); and UPF0313 (Cluster-10, olive nodes).
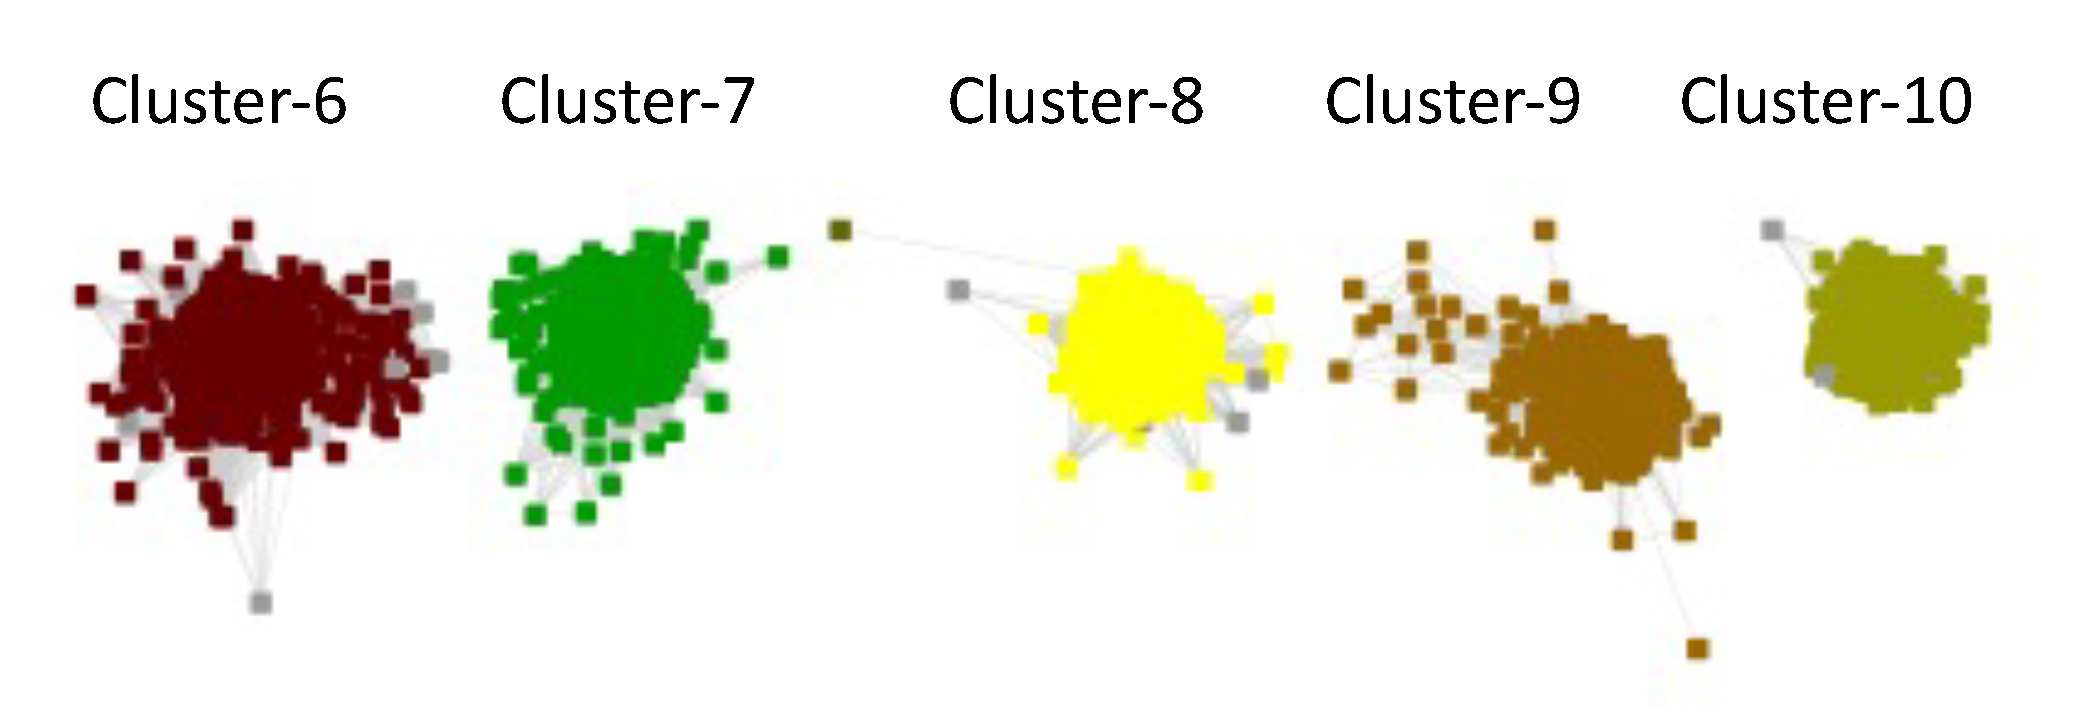
The clusters are numbered in order of decreasing number of UniRef50 IDs/nodes.
Most of the subgroups are functionally diverse. Segregation of the SSNs for these subgroups into isofunctional families/clusters is not easy, e.g., a single alignment score threshold cannot be used to segregate the SSN into isofunctional clusters. For the many of these subgroups, we provide an analysis strategy ("dicing") to facilitate the identification of isofunctional families/clusters.
As described in the "Subgroups" tab, the initial SSN for the entire RSS was generated with UniRef50 clusters/IDs. This coarse granularity is sufficient for identifying subgroups (SFLD-curated and uncharacterized clusters). However, these nodes that conflate sequences sharing ≥50% sequence identity can result in nodes and SSN clusters that are heterofunctional even as the alignment scores is increased, thereby confusing interpretation of MSAs and genome context. Therefore, when possible, UniRef90 clusters/IDs were used to generate the SSNs for these subgroups to maximize the likelihood that as the alignment score is increased, the SSN clusters will become isofunctional.
Segregation of the SSNs for these subgroups into isofunctional families/clusters is not easy, e.g., a single alignment score threshold cannot be used to segregate the SSN into isofunctional clusters.
Analysis Strategy
To solve this problem, for each functionally diverse subgroup a series of SSNs was generated with increasing alignments scores. As the alignment score increases, both the sizes of the clusters and their functional complexity decrease, with isofunctional clusters segregating at alignment scores that are characteristic of the function. We refer to this strategy as "dicing".
The "AS Walk-Through" function is provided so that the user can 1) "walk" forward from any cluster to its progeny clusters in the SSN with the next alignment score or 2) "walk" backward to its progenitor cluster in in the SSN with the previous alignment score. These connections may allow the discovery of divergent functions that share mechanistic attributes.
For each cluster in each SSN, the Explore page provides information to assess whether the cluster is isofunctional, e.g., convergence ratio, number of conserved Cys residues, and, most importantly, genome neighborhood diagrams (GNDs) for the sequences in the clusters.
As described in the description of the Search function, the clusters in the SSNs can be searched with a UniProt ID or sequence.
For each "diced" subgroup, the initial Explore displays the SSN generated with an alignment score of 11 and provides access various types of bioinformatic information about the subgroup.
The Explore page provides a link to the Diced SSNs page. The clusters in each of the diced" SSNs can be viewed by selecting the alignment score (a cluster contains ≥3 UniRef90 IDs/nodes). As the alignment score increases, the clusters decrease in size and complexity. Also, as the alignment score increases, the number of clusters initially increases as the large clusters segregate and then decreases as the small clusters "dissociate" into individual nodes.
The Click here link on the Diced SSNs page accesses the Explore page for the SSN generated with the lowest alignment score. On that (and any) Explore page, any cluster in the current SSN can be selected; also, SSNs generated with other alignment scores can be selected.
Each Explore page includes the "AS Walk-Through" button above the image for the cluster. The "AS Walk-Through" function allows the user to "walk through" the series of "diced" SSNs, allowing identification of the progeny of a cluster (walking forward) or the progenitor of a cluster (walking backward). This function allows, for example, analyses of 1) speciation of orthologues (with the taxonomic distribution of the cluster available via the TAXONOMY button) and 2) divergent evolution of functions from a common progenitor.
Clicking the "AS Walk-Through" button opens a window that identifies 1) the cluster in the previous SSN in the series that contained the sequences in the cluster and 2) the cluster(s) in the next SSN that contain(s) the sequences in the cluster. For each cluster in the window, the number of nodes and CR are provided as well as a button, if present, that expands to provide a list of the SwissProt functions in the cluster. The cluster is a link to the cluster; clicking the link opens the Explore page for the cluster.
Exploring subgroups
This section describes the Search function results when the input UniProt ID or sequence matches a sequence located in a cluster (≥3 UniRef90 nodes) in the "diced" functionally diverse subgroups. Refer to the description of the Search tab for results when the input matches one of the other subgroups.
With the Find by UniProt ID function, the user provides a UniProt ID for searching all of the clusters in RadicalSAM.org. When the ID is located in the "diced" SSNs of a functionally diverse subgroup, the Results page provides a list of clusters in the "diced" SSNs that contain the UniProt ID along with the number of UniProt IDs, number of cluster nodes, and UniProt ID convergence ratio (CR; described on the Explore Pages tab). The clusters are links to the Explore page for that cluster (see Explore Pages tab for a description of the information provided on the Explore page).
As the alignment score used to generate the diced clusters increases, a UniProt ID may located in a cluster with ≤2 UniRef90 ID nodes. When this occurs, the Search will report "ID not found". Generation of the MSA, WebLogo, HMM, Length Histograms, tables of Conserved Cys Residues, and files with IDs and FASTA sequences for a cluster requires that the cluster contain ≥3 UniRef90 nodes.
With the Find by Sequence function, the user provides a sequence (with/without a FASTA header) for first searching the HMMs of the subgroups to identify the subgroup with smallest e-value. If the smallest e-value is for a functionally diverse subgroup, the HMMs for all of the clusters in the series of "diced" SSNs in that subgroup are searched.
The Results page provides a list of the three clusters at each alignment score with the smallest e-values along with the number of UniProt IDs, number of cluster nodes, and UniProt ID convergence ratio (CR; described on the Explore Pages tab). The cluster identifiers are links to the Explore page for that cluster (see Explore Pages tab for a description of the information provided on the Explore page).
As the alignment score used to generate the "diced" SSN increases, the e-value typically decreases as the alignment score increases and the cluster becomes orthologous/isofunctional as nonorthologous sequences are removed.
As the alignment score used to generate the diced clusters increases and if/when the user-provided sequence segregates into a cluster with ≤2 UniRef90 ID nodes for which an HMM is not generated, the Search results will continue to identify the three best clusters but the e-values likely will be larger than those identified for clusters containing the sequence.
An image of the cluster is presented on its Explore pages: an isofunctional cluster likely will be "spherical", with each node/sequence connected to all other nodes with an edge so the value of CR will approach 1.0. Functional homogeneity within each cluster also can be assessed by inspection of the Conserved Cys Residue table as well as the genome neighborhood diagrams (GNDs) for the UniRef90 node IDs and the UniProt IDs.
An Explore page is provided for each SSN cluster in RadicalSAM.org.
- SwissProt-annotated functions (button)
- KEGG annotated sequences (button)
- PDB files (button)
- TIGRFAM families (button)
- Taxonomy sunburst (button)
- Genome neighborhood diagrams (GNDs; button)
- Clusters sizes (numbers of UniProt, UniRef90, and UniRef50 IDs)
- Convergence Ratio (CR) for the UniProt IDs and UniRef node IDs,
- Summary of the number of Conserved Cys Residues as a function of sequence conservation (from 90% to 10%, decreasing in steps of 10%)
- WebLogo and multiple sequence alignment (MSA; generated with MUSCLE; can be viewed with Jalview that is available for download from https://www.jalview.org/)
- HMM (viewed interactively using Skylign at https://skylign.org/; a text file is also available for download)
- Length histograms for UniProt, UniRef90, and UniRef50 IDs
- SSN for the displayed cluster (xgmml file for Cytoscape; download)
- Lists of UniProt, UniRef90, and UniRef50 IDs (download)
- UniProt, UniProt90, and UniRef50 FASTA files (download)
- AlphaFold IDs
- A table with the number and residue positions of conserved Cys residues in the MSA (download).
Convergence ratio (CR): The CR is the ratio of the number of sequence pairs with edge alignment score values (derived from BLAST e-values/bit scores) ≥ the minimum alignment score threshold used to generate the SSN to the total number of sequence pairs. The value of CR ranges from 1.0 for sequences that are very similar ("identical") to 0.0 for sequences that are unrelated at the specified alignment score.
At small values of the alignment score, the value of CR for a cluster can be ~ 1.0 even if the cluster is heterofunctional (e-values are large; pairwise sequence similarity is small). However, at larger values of the alignment score, clusters with values approaching 1.0 are likely to be isofunctional (e-values are small; pairwise sequence identity is large).
Isofunctional clusters, as judged by shared genome context in the GNDs, often have CR values that approach 1.0. However, the values of CR for isofunctional/orthologous clusters that contain sequences from phylogenetically diverse species can decrease with increasing alignment score as the sequence divergence between orthologues in different phylogenetic groups cause the CR to decrease. In such situations, as the alignment score increases, an isofunctional cluster with a low value for CR can segregate into smaller clusters for different phylogenetic groups with CR values that approach 1.0. Thus, values of CR that approach 1.0 are not required for isofunctionality; inspection of the GNDs allows that assessment.
Conserved Cys Residues: A list is provided of the number of Conserved Cys Residues as a function of percent conservation in the MSA. Recall that, by definition, members of the RSS share a Cx3Cx2C motif for SAM-binding. Conserved Cys residues in excess of 3 may be associated with additional FeS clusters, e.g., members of the SFLD subgroup 17, SPASM/Twitch domain.
The sequences in the cluster are not edited prior to construction of the MSA, so some will be truncated (even if their Sequence Status is "Complete"). Also, if the alignment score threshold is less than that required for isofunctionality, the sequences in the MSA will be heterofunctional and, therefore, heterogeneous in length. Therefore, the Number of Conserved Cys Residues can be expected to be a function of percent conservation, with the most abundant conserved Cys motifs represented at large values of percent conservation and conserved Cys motifs in less abundant sequences/functions represented at lower values of percent conservation. Therefore, with the caveat that the sequences in the cluster cannot be expected to be uniform in length, this summary can be used to evaluate sequence and function heterogeneity.
The Conserved Cys Residues can/should be used together with the MSA, CR, length histograms, and GNDs in identifying isofunctional clusters
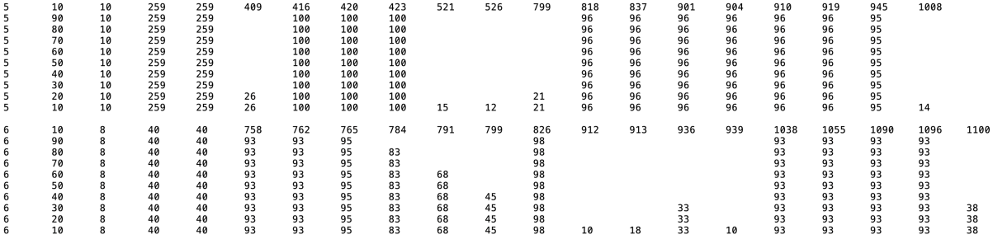
Consensus Cys Residues: A text file ("Consensus residue percentage summary table") is available for download. In the MSA (SSN cluster number in column 1), the positions of Cys residues identified at 90%, 80%, 70%, 60%, 50%, 40%, 30%, 20%, and 10% conservation (column 2) are identified in columns 6 and greater. The number in column 3 is the number of Cys residues conserved that percent conservation columns 4 and 5 provide the number of IDs in the cluster. The canonical Cx3Cx2C is easily identified; additional conserved Cys residues may provide ligands to auxillary Fe-S centers.
MSAs and WebLogos: The MSA for all UniRef node IDs is generated using MUSCLE. The WebLogo calculated from the MSA is displayed. The conserved Cys residues are colored in red to allow easy identification of the canonical SAM-binding Cx3Cx2C motif as well other conserved Cys residues. Their height is proportional to percent conservation; their intensity is determined by residue occupancy in the MSA.
The MSA is available for download and can be viewed with Jalview (https://www.jalview.org/). The WebLogo is available as a png file.
HMMs: The HMM for the cluster generated from the MSA using hmmbuild is provided. It can be viewed as an image generated by Skylign (https://skylign.org/). The image can be downloaded as a png file. The text file for the HMM is available for download and use for identifying sequences in the UniProt database using hmmsearch (https://www.ebi.ac.uk/Tools/hmmer/search/hmmsearch).
Genome Neighborhood Diagrams (GNDs): The Genome Neighborhood Diagrams button provides genome neighborhood diagrams (GNDs) for the node IDs in each cluster. These are displayed using the GND Explorer used by the EFI-GNT tool. The GNDs provide information about both functional heterogeneity (one or several genome neighborhoods; one or more functions) and possible metabolic pathways (Pfam/InterPro families of proximal genes).
For UniRef50 SSN clusters, the default GND display is UniRef50 node IDs in the cluster; for UniRef90 SSN clusters, the default display is UniRef90 nodes IDs in the cluster.
The GNDs for the UniRef90 IDs in each UniRef50 node are available by clicking the "+" link adjacent to each UniRef50 GND.
The GNDs for the UniProt IDs in each UniRef90 node are available by clicking the "+" link adjacent to each UniRef90 GND.
Three Search functions are provided for locating clusters (with ≥3 UniRef IDs/nodes) using a UniProt ID, Sequence, or taxonomy as query.
Find by UniProt ID
The user inputs a UniProt ID to identify the cluster in which it is located. The search opens the Explore page for the cluster that contains the UniProt ID.
In some SSNs, the query UniProt ID may be located in a cluster with ≤2 nodes or represented as a singleton. The Search will report: "ID not found".
If the cluster is in a "diced" functionally diverse subgroup, the clusters in the "diced" SSNs for the (mega)cluster (series of increasing alignment scores) are listed. The number of UniProt IDs, number of cluster nodes, and UniProt ID convergence ratio (CR; described on the Subgroups tab) are provided for each identified cluster.

Find by Sequence
The user inputs a sequence (with/without a FASTA header) that is used to query the HMMs for all clusters (≥3 UniRef IDs/nodes) using hmmscan.
The Results page reports the three clusters with the smallest e-values. The cluster number is a link to the Explore page for the cluster.
If the cluster with the lowest e-value is in a "diced" functionally diverse subgroup, the three clusters with the smallest e-values in each of the "diced" SSNs are listed. The number of UniProt IDs, number of cluster nodes, and UniProt ID convergence ratio (CR; described on the Subgroups tab) are provided for each identified cluster.
The "Exploring Subgroups" subtab of the Functional Diverse Subgroups tab provides additional information for exploring these functionally diverse (mega)clusters.
Find by Taxonomy
The user provides the genus/species/strain for an organism to identify the clusters in which its members are located.
If only the genus is entered, a pop-up list of matching genus-species-strains is provided for selection of the desired genus/species/strain. If the genus and species are entered, a pop-up list of matching genus-species-strains is provided for selection of the desired genus/species/strain.
The search provides a list of sequences in the RSS. The list provides the UniProt ID (link to the UniProt page for sequence), UniProt description, organism name, UniProt annotation status (SwissProt or TrEMBL), and link to its Explore page.